
5.5: Scored Assessment
- Page ID
- 14422

\( \newcommand{\vecs}[1]{\overset { \scriptstyle \rightharpoonup} {\mathbf{#1}} } \) \( \newcommand{\vecd}[1]{\overset{-\!-\!\rightharpoonup}{\vphantom{a}\smash {#1}}} \)\(\newcommand{\id}{\mathrm{id}}\) \( \newcommand{\Span}{\mathrm{span}}\) \( \newcommand{\kernel}{\mathrm{null}\,}\) \( \newcommand{\range}{\mathrm{range}\,}\) \( \newcommand{\RealPart}{\mathrm{Re}}\) \( \newcommand{\ImaginaryPart}{\mathrm{Im}}\) \( \newcommand{\Argument}{\mathrm{Arg}}\) \( \newcommand{\norm}[1]{\| #1 \|}\) \( \newcommand{\inner}[2]{\langle #1, #2 \rangle}\) \( \newcommand{\Span}{\mathrm{span}}\) \(\newcommand{\id}{\mathrm{id}}\) \( \newcommand{\Span}{\mathrm{span}}\) \( \newcommand{\kernel}{\mathrm{null}\,}\) \( \newcommand{\range}{\mathrm{range}\,}\) \( \newcommand{\RealPart}{\mathrm{Re}}\) \( \newcommand{\ImaginaryPart}{\mathrm{Im}}\) \( \newcommand{\Argument}{\mathrm{Arg}}\) \( \newcommand{\norm}[1]{\| #1 \|}\) \( \newcommand{\inner}[2]{\langle #1, #2 \rangle}\) \( \newcommand{\Span}{\mathrm{span}}\)\(\newcommand{\AA}{\unicode[.8,0]{x212B}}\)
Tables for a Retail Company
Download Data File: SC5 Data
Retail companies with today’s online, as well as, in-store sales have a lot of data to keep track of! Keeping track of sales, costs, and profits on a daily basis is essential to making the most of a business. This exercise illustrates how to use the skills presented in this chapter to generate the data needed on a daily basis by a retail company.
- Open the data file SC5 Data and save the file to your computer as SC5 Dynamite Customer Sales.
- Click the Sales Sheet. Format the data set as a table. Choose a style from the styles gallery.
- Create the following calculated columns.
- In I4, and J4, use a VLOOKUP function that will look up the Product Price and Product Cost based on the Product Sold column which lists an ID number. [Hint: The Product Table sheet lists the Price and Cost] If any error messages appear, check the Range Lookup.
- In K4, use a formula to calculate Profit. Hint: Profit =(Product Price-Product Cost)*Units Sold
- Format columns I, J, and K as currency with two decimal places.
- Make a copy of the Sales sheet and rename it Online Sales by Date. Place this sheet to the right of the Sales sheet. Answer the following question by filtering the data accordingly. What was the total Profit for Online Sales? Sort the results by Date Sold (A/Z).
- Make a copy of the Sales sheet and rename it June Sales by Country. Place this new sheet to the right of the Online Sales by Date sheet. Answer the following question by filtering the data accordingly. In June, for all products sold, what was the total profit earned? Sort the results by Country, then Name both in (A/Z).
- Make another copy of the Sales sheet and rename it Sales by Product. Place this new sheet to the right of the June Sales by Country sheet. Using a slicer, filter the data accordingly to display the average Product Price, Product Cost, and Profit for DETA100 and DETA200 items. Sort the filtered sheet by Product Sold. [Hint: In the total row make sure to type the word Average in column A.]
- Make one final copy of the Sales sheet and rename it Subtotals by Sales Type. Place this new sheet to the right of the Sales by Product sheet. Subtotal the sheet by Sales Type, summing the Profit column.
- Add a 2nd subtotal to the Subtotals by Type sheet that subtotals by Sales Type and averages the Profit column.
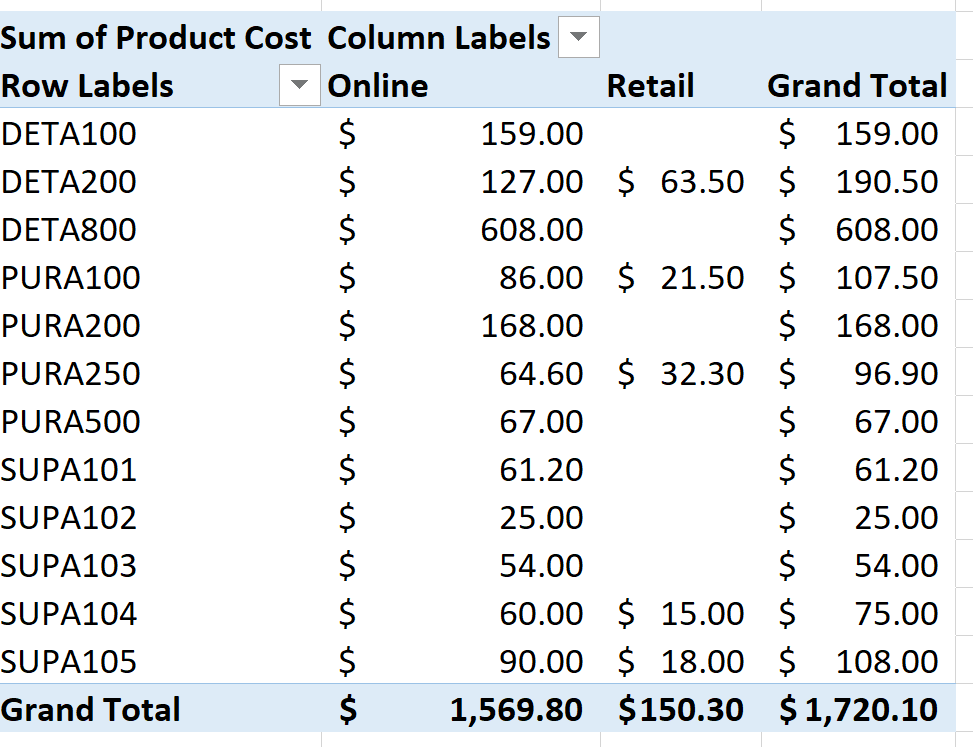
- From the Sales sheet, create the below PivotTable totaling per product type the Product Cost for Online and Retail sales. Insert the PivotTable as a new sheet. Name the sheet ProductPT.
- For each worksheet, add a footer with the worksheet name in the center and your name in the right panel.
- Preview each worksheet in Print Preview and make any necessary changes for professional printing. (Hint: Orientation, page scaling, and print titles might need to be used.)
- Check the spelling on all of the worksheets and make any necessary changes. Save the SC5 Dynamite Customer Sales workbook, and submit the file as directed by your instructor.
Attribution
“5.5 Scored Assessment” by Hallie Puncochar and Diane Shingledecker, Portland Community College is licensed under CC BY 4.0