
6.5: Chapter Practice
- Page ID
- 14427

\( \newcommand{\vecs}[1]{\overset { \scriptstyle \rightharpoonup} {\mathbf{#1}} } \) \( \newcommand{\vecd}[1]{\overset{-\!-\!\rightharpoonup}{\vphantom{a}\smash {#1}}} \)\(\newcommand{\id}{\mathrm{id}}\) \( \newcommand{\Span}{\mathrm{span}}\) \( \newcommand{\kernel}{\mathrm{null}\,}\) \( \newcommand{\range}{\mathrm{range}\,}\) \( \newcommand{\RealPart}{\mathrm{Re}}\) \( \newcommand{\ImaginaryPart}{\mathrm{Im}}\) \( \newcommand{\Argument}{\mathrm{Arg}}\) \( \newcommand{\norm}[1]{\| #1 \|}\) \( \newcommand{\inner}[2]{\langle #1, #2 \rangle}\) \( \newcommand{\Span}{\mathrm{span}}\) \(\newcommand{\id}{\mathrm{id}}\) \( \newcommand{\Span}{\mathrm{span}}\) \( \newcommand{\kernel}{\mathrm{null}\,}\) \( \newcommand{\range}{\mathrm{range}\,}\) \( \newcommand{\RealPart}{\mathrm{Re}}\) \( \newcommand{\ImaginaryPart}{\mathrm{Im}}\) \( \newcommand{\Argument}{\mathrm{Arg}}\) \( \newcommand{\norm}[1]{\| #1 \|}\) \( \newcommand{\inner}[2]{\langle #1, #2 \rangle}\) \( \newcommand{\Span}{\mathrm{span}}\)\(\newcommand{\AA}{\unicode[.8,0]{x212B}}\)
CREATING A Multiple Sheet Workbook for a Sports Team
Data file: PR6 Data
You have just been hired by Pacific Northwest Soccer Club, and you quickly realize that there isn’t a consistent way for all the coaches to keep track of their team statistics. To help with this, you decide to create a multiple sheet workbook for Season Stats for each team. Since you are also the coach of the High Flyers Team this season, you will need to use the workbook to enter your team’s statistics.
- Open the data file PR6 Data and save the file to your computer as PR6 Pacific NW Sports Team.
- Copy the range B11:G22 in the Season Stats sheet to the same range in the Player Stats sheet.
- You will add formulas to this worksheet before entering the data later in the assignment. Group the sheets and add the following formulas to both sheets:
- In C22 and D22, you will need to count the Xs (that you will enter later) in rows 12 through 21. To do this, use the COUNTA function. If necessary, review the COUNTA function in Chapter 2. Your formulas will return zeros for now, until you enter the data.
- In E22 and F22, sum rows 12 through 21.
- In G12, calculate the Goal Percentage by dividing the number of Goals by the number of Shots. This formula will display an error message because there is no data in column E (Excel shows the #DIV/0! error when a number is divided by zero). We don’t want to display error messages, so an IF statement that tests the value of column E will solve this problem.
- Change the formula in G12 to an IF Function with the following three arguments:
- Test – is E12 greater than zero
- If the Test is True – divide the number of Goals by the number of Shots
- If the Test is False – enter a zero
- Copy G12 down the column through G22. Format these cells as percentages.
- Ungroup the sheets.
- Save the file.
- In the Season Stats sheet, enter the following data:
- D3 – High Flyers
- D4 – Fall and the current year (i.e. – Fall 2020)
- D5 – Pacific Northwest Soccer
- Enter your name, phone number, and email address in row 8.
- Make two copies of the Player Stats worksheet. Rename the Player Stats worksheets Player 1, Player 2 and Player 3.
- Group the Player sheets only. Enter the following formulas:
- A formula in D4 that points (links) to cell D3 in the Season Stats sheet. Your formula should be =’Season Stats’!D3.
- A formula in D5 that points to cell D4 in the Season Stats sheet.
- A formula in D6 that points to cell D5 in the Season Stats sheet.
- Ungroup the sheets.
- Click on the Player 1 sheet. Enter the Player Name: Juan Ramirez. Enter the following data from Table 1 below:
Table 1: Player 1 SheetPlayed Started Shots Goals Game 1 x x 2 1 Game 2 x x 3 1 Game 3 Game 4 x Game 5 x x 2 0 Game 6 x Game 7 Game 8 x x 1 1 Game 9 x x 4 2 Game 10 x x 3 3 - Click on the Player 2 sheet. Enter the Player Name: Zach Johnson. Enter the following data from Table 2 below:
Table 2: Player 2 SheetPlayed Started Shots Goals Game 1 x x 1 1 Game 2 x x 2 1 Game 3 x x 1 1 Game 4 x x 1 1 Game 5 x x 2 0 Game 6 x x 5 2 Game 7 x x 4 2 Game 8 x x 1 1 Game 9 x x 4 1 Game 10 x x 3 2 - Click on the Player 3 sheet. Enter the Player Name: Vito Lawrenz. Enter the following data from Table 3 below:
Table 3: Player 3 SheetPlayed Started Shots Goals Game 1 x x 0 0 Game 2 x x 1 1 Game 3 x x 2 0 Game 4 x 1 1 Game 5 x x 2 0 Game 6 x x 3 1 Game 7 x x 2 1 Game 8 x x 1 1 Game 9 x x 1 1 Game 10 x x 1 1 - Go to the Season Stats sheet and click on cell C12. Enter a 3-D formula to COUNTA (count the x’s) in C12 for the Player 1 through Player 3 sheets. Copy the formula in C12 through D21.
- Change the formulas in C22 and D22 from COUNTA to SUM.
- Click on E12. Enter a 3-D formula to SUM cell E12 in the Player 1 through Player 3 sheets. Copy the formulas through F21.
- Preview the worksheets in Print Preview. Notice that only part of the data is printing for each worksheet. This is because a Print Area was incorrectly set when the file was first created. You need to clear this Print Area for each worksheet individually (modifying print areas cannot be done on grouped sheets). Exit Backstage View and for each worksheet, click the Print Area button on the Page Layout tab and select Clear Print Area.
- Group the sheets and add a Custom Footer that shows the Sheet Name in the center of the footer.
- Double check Print Preview to make sure each sheet is printing on one page, and that the Sheet Name shows in the center of the footer.
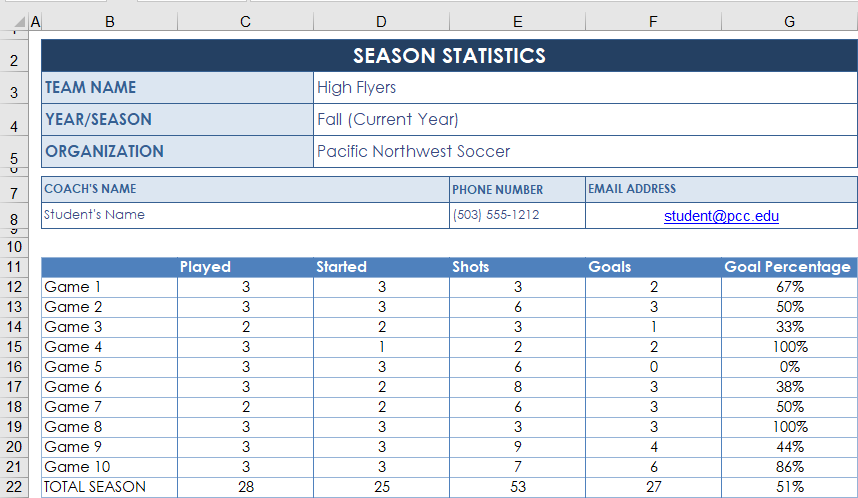
- Your completed Seasons Stats sheet should look like Figure 6.14. n
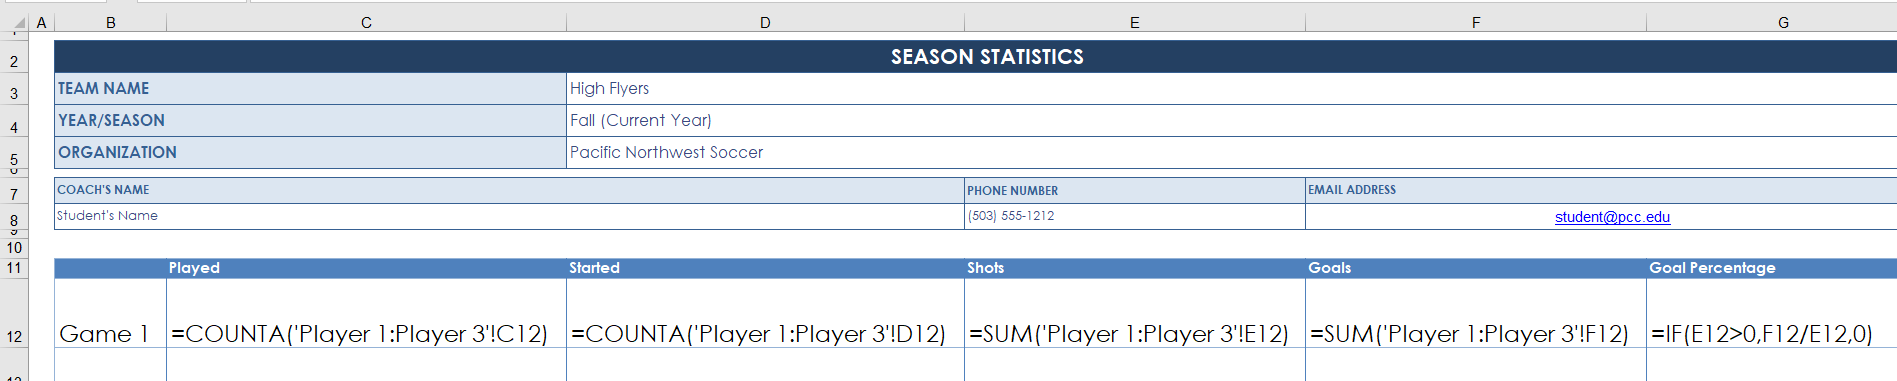
- The formulas in row 12 of the Seasons Stats sheet should match Figure 6.15. n
- Check the spelling on all of the worksheets and make any necessary changes.
- Save the PR6 Pacific NW Sports Team workbook and submit as directed by your instructor.
Attribution
” 6.5 Chapter Practice” by Mary Schatz and Diane Shingledecker, Portland Community College is licensed under CC BY 4.0