
5.9: Bar and Column Charts
- Page ID
- 14325

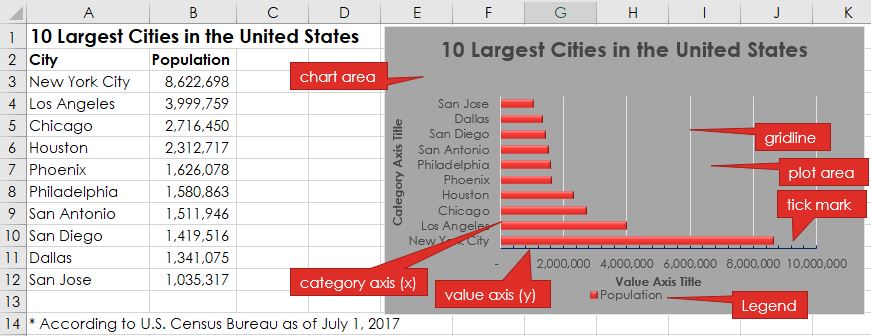
Bar charts are practical for comparing the differences between values with horizontal bars. The lengths of the bars are proportional to the size of the data category they represent. A vertical bar chart is referred to as a column chart, and they are basically the same – just 90° apart. Unlike a pie chart, a bar chart can include several series of data. Bar charts are simple, easy and flexible, and thanks to the horizontal layout, bar charts can accommodate longer category names. Bar (and column) charts contain the following objects:
- Chart title – describes what is charted.
- Chart area – the entire chart and all of its elements.
- Plot area – the region within the horizontal and vertical axes.
- Axes titles (horizontal, vertical)- describe the data.
- Legend – an index of information that corresponds to the series names.
- Data labels – identify each value in a data series.
- Value axis (y-axis) – contains values. Horizontal axis on bar charts and vertical axis on column charts.
- Category axis (x-axis) – contains the category labels. Horizontal axis on column charts and vertical axis on bar charts.
- Gridlines – mark the intervals on an axis.
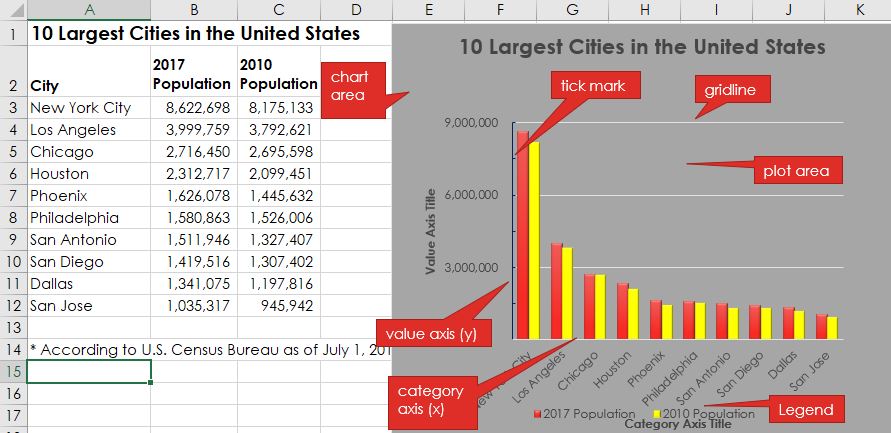
While the data and chart above only displays one data series, most bar and column charts tend to display multiple data series to compare and contrast one set of data against another. The chart below adds a second data series in column C, and changes the chart type to a column chart. The two different data series are illustrated with different color data points. Also, note how the axes change directions! The value axis maximum, major and minor units were also modified to different numerical values.
Charts can easily get crowded with details. Therefore, keeping the chart on the same worksheet as the data is not always feasible. Users can move a chart to any location on a worksheet or to a new or existing worksheet. By default, a chart is created as an object within a sheet. The chart can be resized, but sometimes the chart needs to be as large as possible. To move the chart to a new worksheet, click the Move Chart button on the Chart Tools Design tab.
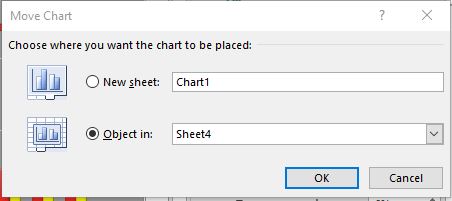
Next, click the New sheet radio button, and then in the New sheet box, type a name for the new worksheet. After clicking OK, the new sheet will be to the left of the existing sheet. A new, standalone chart will occupy the entire page to maximize the visibility of the data. The Move Chart window also provides the option of moving the chart as an embedded object into an existing sheet.