
2.2: Diagramming a Business Process
- Page ID
- 4420
Learning Objectives
- Create deliverables for the first two phases of the systems development life cycle
- Create As-Is and To-Be process diagrams for the redesign of a business process
- Given an advertisement, research and represent the business process redesign
- Manipulate images and text to create a best practice diagram in PowerPoint
- Choose and successfully employ PowerPoint techniques to solve a complex task
Actors and Actions
Improving a business process requires first understanding the process. Diagramming the steps in the process contributes greatly to that understanding. Business process diagrams typically consist of actions linked by arrows. However, it is also important to be clear about who is performing each action. For this reason we create a swim lane for each actor in the process. The actors pass a metaphorical baton among themselves at different stages of the process.
An easy way to diagram a business process is to first identify all of the actors and place each in a swim lane. The process begins at the top of the page and continues down the page following the arrows. Arrows represent communication among the actors, while diamonds represent decision points. While actors are normally people, a computer standing in for the role of a person can also be an actor.
At times we can simplify the business process diagram by eliminating all but the essential elements. This makes the diagram less cluttered and easier to read. On the facing page we have a process diagram reduced to just three elements — swim lanes, actions, and arrows.
For the level of analysis needed in this course, the simplified diagram is more than sufficient. However, it is good to know the full lexicon, especially the decision point diamond shown on the next page.
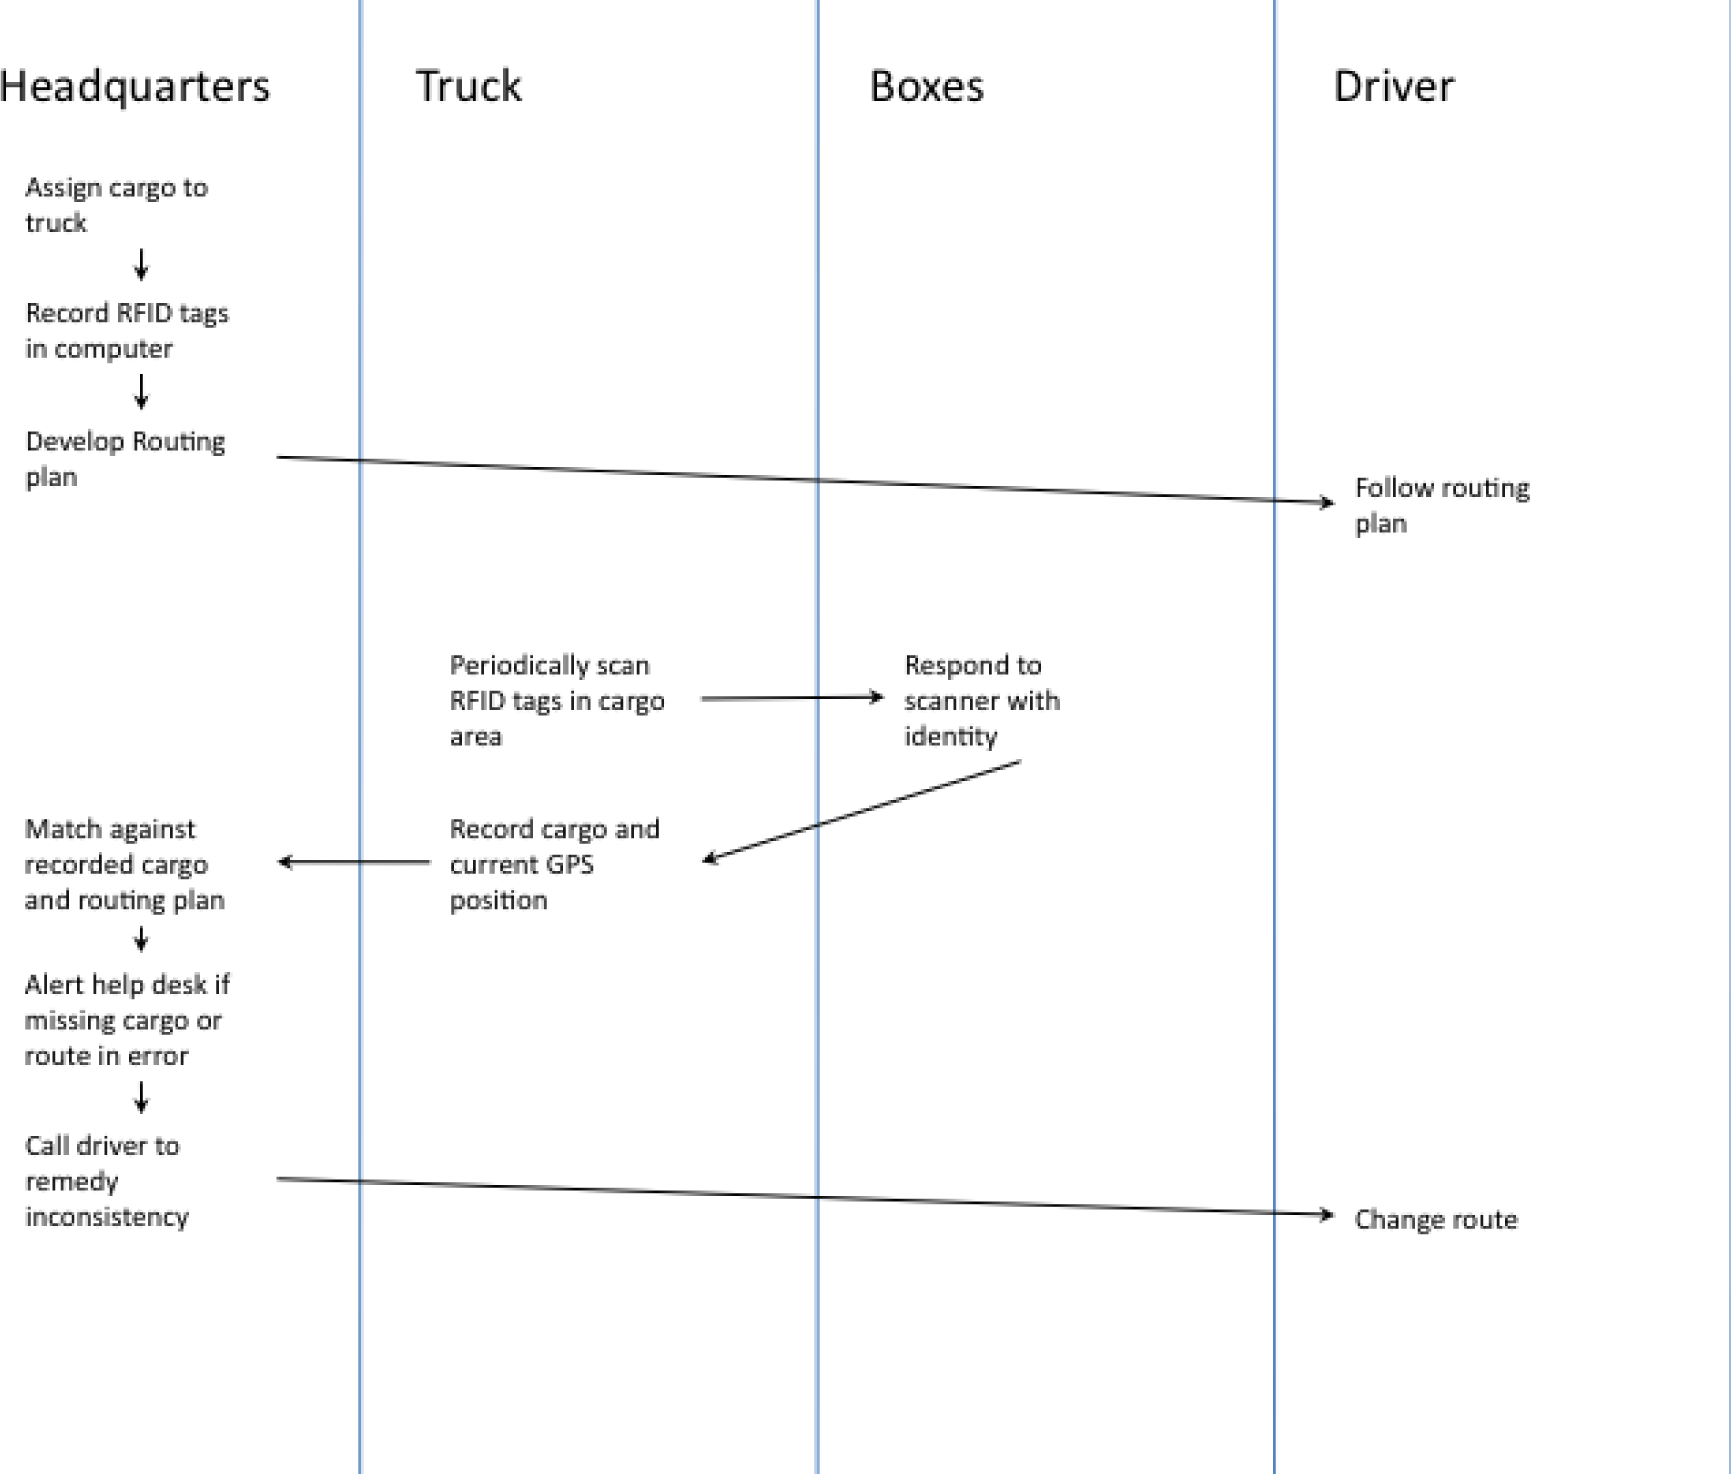
To-Be business process for IBM’s package routing solution. In this solution Radio Frequency Identification (RFID) tags in the boxes communicate with their surroundings to report their geographic position back to the help desk. If a truck has taken the wrong turn, the boxes will notify the help desk. A help desk employee will in turn communicate by phone with the truck driver to reroute the truck.
It’s More Complicated Than That
What we showed on the prior page is actually a simplified form of a business process diagram. For the purpose of this course, the simplified form works just fine. However for the sake of completeness, we show a more advanced diagram more in the spirit of Universal Modeling Language (UML). It is not that the UML style diagram is better—just that you should be prepared to see it. The following table lists some of the symbols that you might encounter in a process flow diagram.
Table 2.1
|
Action state |
|
An action taken in the flow |
|
Start state |
|
A beginning of a flow; only one start state can be used |
|
End state |
|
An end of a flow; any number of end states are allowed |
|
Transition |
|
Indicates the control passing from one object to another |
|
Decision point |
|
Showing possible options and paths to follow |
|
Fork |
|
The beginning of parallel processes |
|
Join |
|
The integration of parallel processes |
|
Swim lane |
|
Represents ownership or assignment of a group of actions |
|
Artifact |
|
An object involved in the system, such as a server or database |


Key Takeaways
- A business process can be diagrammed by showing actors in swim lanes taking actions. Communication or message passing among the actors is represented by arrows.
Questions and Exercises
- Diagram the As-Is and To-Be processes before and after online dating.
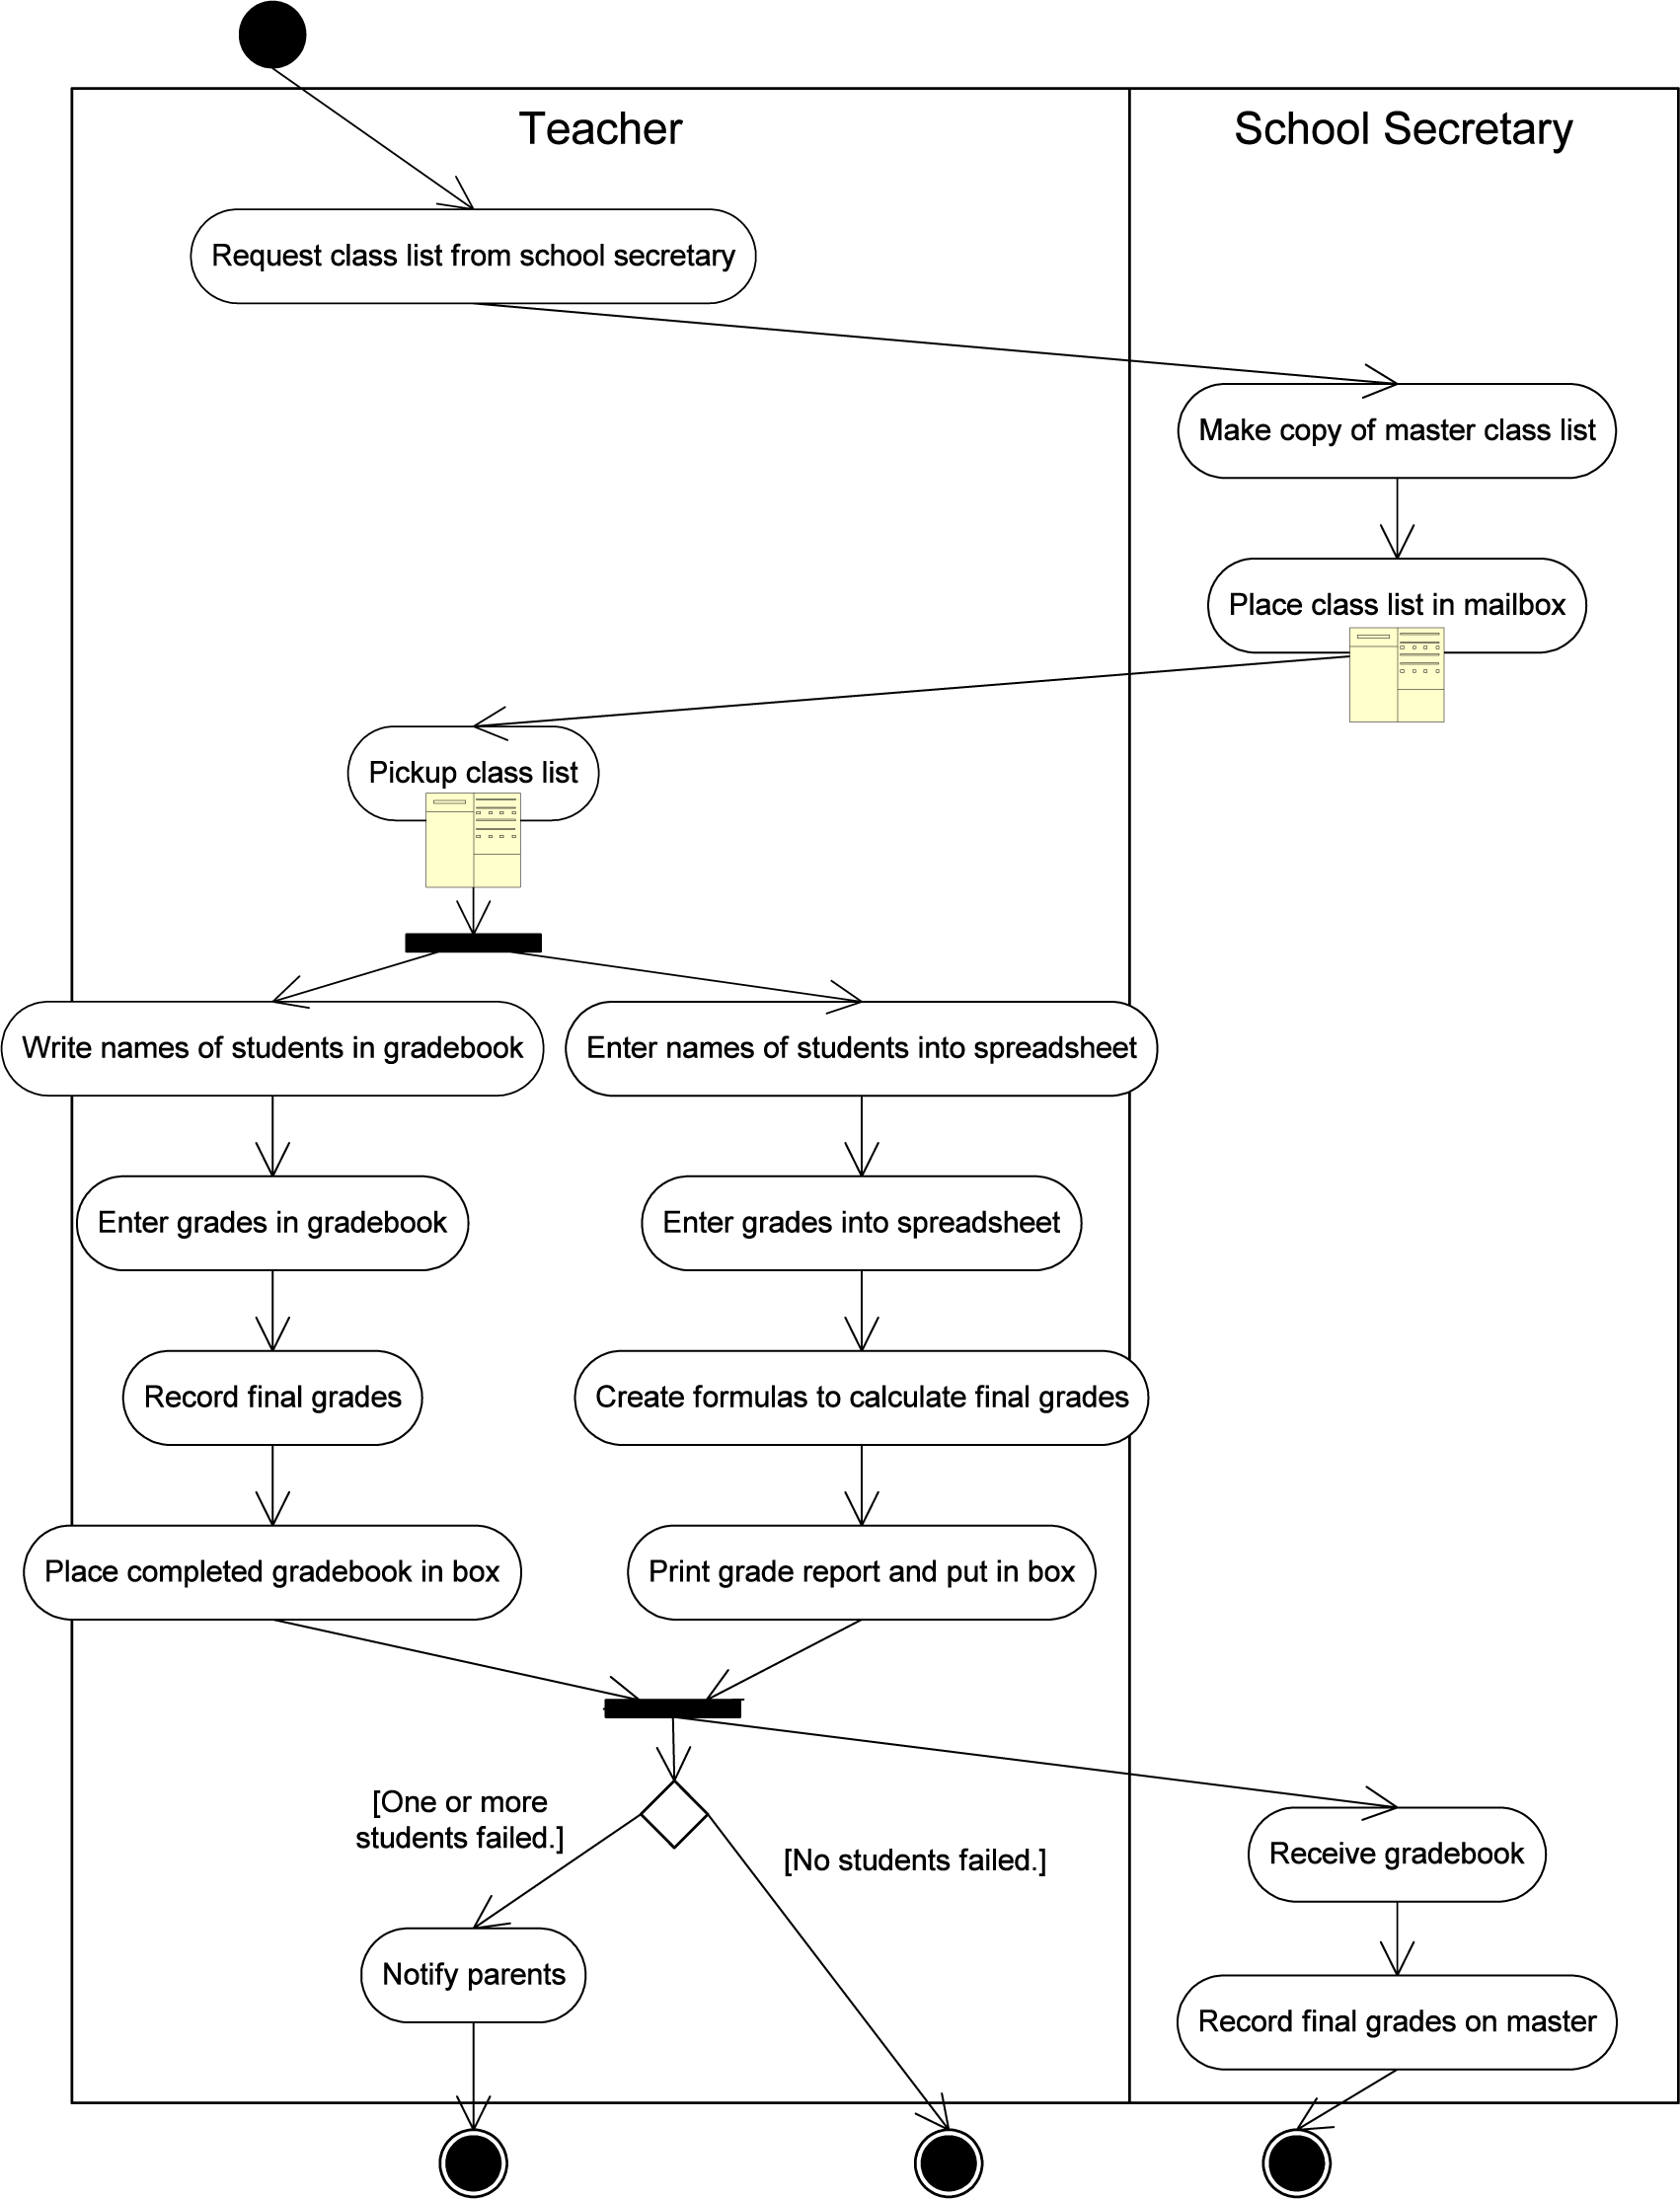
Universal Modeling Language (UML) style As-Is process flow for recording grades.
Techniques
The following techniques, found in the PowerPoint section of the software reference, may be useful in completing the assignments for this chapter.: Layout-Change • Align • Shape-Insert • Text Box-Insert
L1 Assignment: Diagram Business Processes
Create As-Is and To-Be diagrams of a business process, given a video commercial. Many commercials on TV are really advertisements for improved business processes. IBM has been particularly active in this arena. IBM’s focus on business process improvement makes sense given that IBM is one of the largest consulting organizations in the world. In this exercise, you will view a commercial on YouTube and then create the As-Is and To-Be business process diagrams that the commercial implicitly represents.
Setup
Start up PowerPoint.
Content and Style
- Use the drawing tools in PowerPoint to create swim lanes and diagram the As-Is and To-Be business processes on separate slides.
- Make sure you title each slide to identify which is which.
- Align and space the content consistently. A sharp looking diagrams conveys professionalism.
- Include a copyright symbol and your name in the bottom left corner.
- When you are finished, submit the PowerPoint file according to your professor’s instructions. Your professor may want hard copy or an electronic submission to the course management system.
Deliverable
Electronic submission: Save your file as a PowerPoint presentation. Submit it electronically.
Paper submission: Create a printout by printing the slides directly out of PowerPoint.
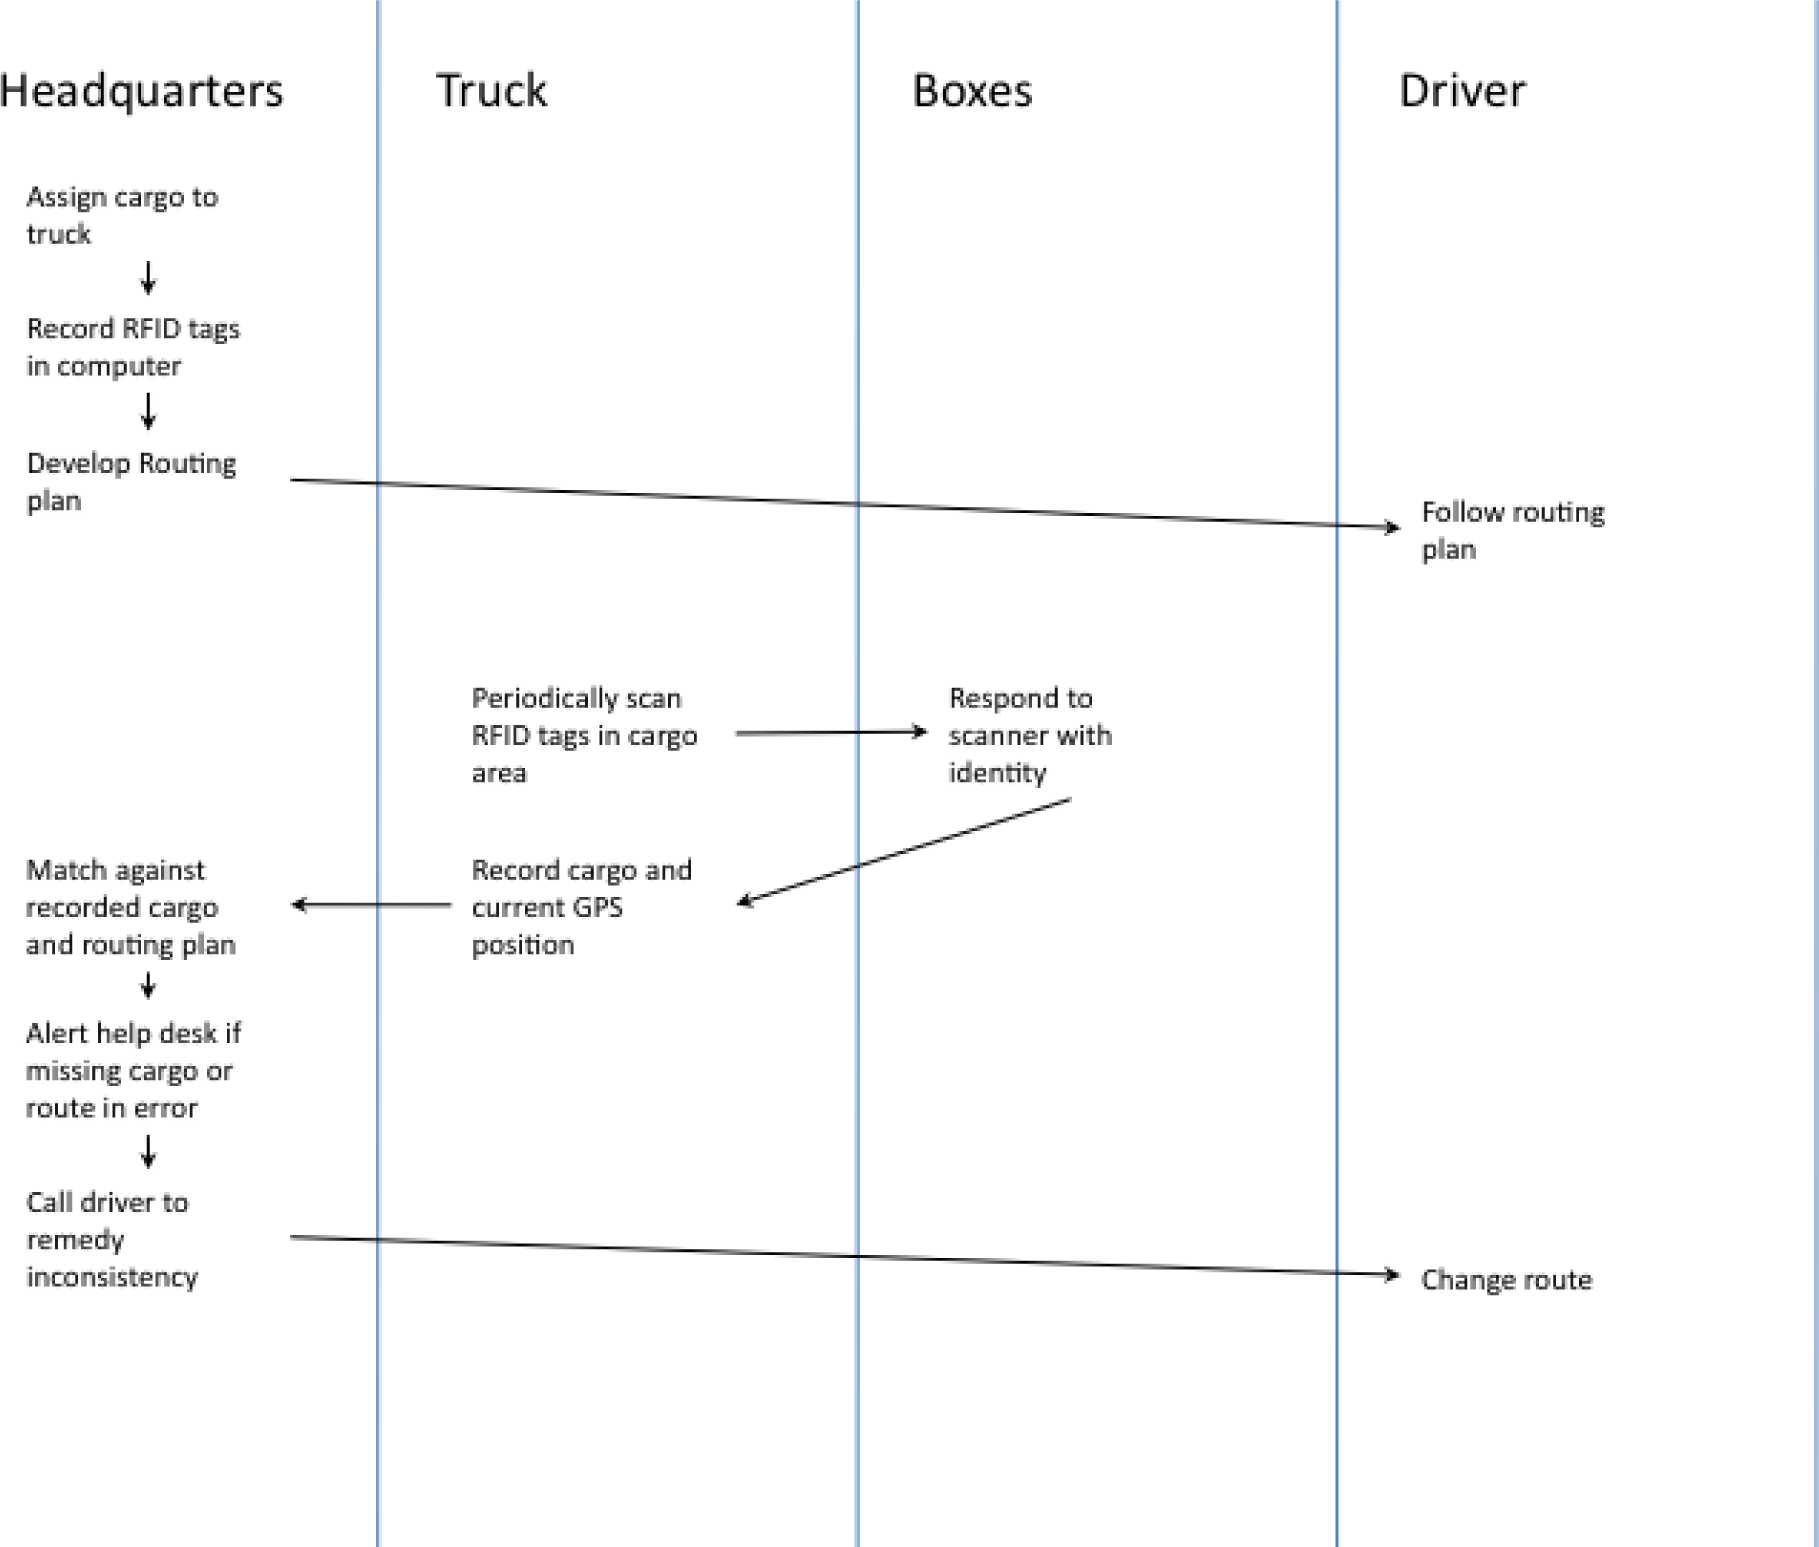
Sample To-Be deliverable for the IBM RFID trucking commercial.