
5.3: Hydrological Hazards
- Page ID
- 3945
The principal hydrological hazards of concern to environmental hazard managers are floods, storm surges, and tsunamis.
Floods
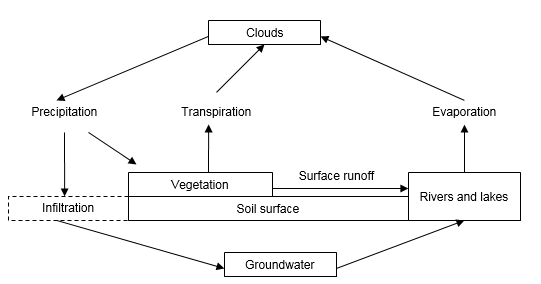
Flooding is a widespread problem in the United States that accounts for three-quarters of all Presidential Disaster Declarations. A flood is an event in which an abnormally large amount of water accumulates in areas where it is usually not found. Flooding is determined by a hydrological cycle in which precipitation falls from clouds in the form of rain and snow (see Figure 5-1). When it reaches the ground, the precipitation either infiltrates the soil or travels downhill in the form of surface runoff. Some of the water that infiltrates the soil is taken up by plant roots and transported to the leaves where it is transpired into the atmosphere. Another portion of the ground water gradually moves down to the water table and flows underground until reaching water bodies such as wetlands, rivers, lakes, or oceans. Surface runoff moves directly to surface storage in these water bodies. At that point, water evaporates from surface storage, returning to clouds in the atmosphere.
Figure 5.1: The Hydrological Cycle
There are seven different types of flooding that are widely recognized. Riverine (main stem) flooding occurs when surface runoff gradually rises to flood stage and overflows its banks. Flash flooding is defined by runoff reaching its peak in less than six hours. This usually occurs in hilly areas with steep slopes and sparse vegetation, but also occurs in urbanized areas with rapid runoff from impermeable surfaces such as streets, parking lots, and building roofs. Alluvial fan flooding occurs in deposits of soil and rock found at the foot of steep valley walls in arid Western regions. Ice/debris dam failures result when an accumulation of downstream material raises the water surface above the stream bank. Surface ponding/local drainage occurs when water accumulates in areas so flat that runoff cannot carry away the precipitation fast enough. Fluctuating lake levels can occur over short-term, seasonal, or multiyear periods, especially in lakes that have limited outlets or are entirely landlocked. Control structure (dam or levee) failure has many characteristics in common with flash flooding.
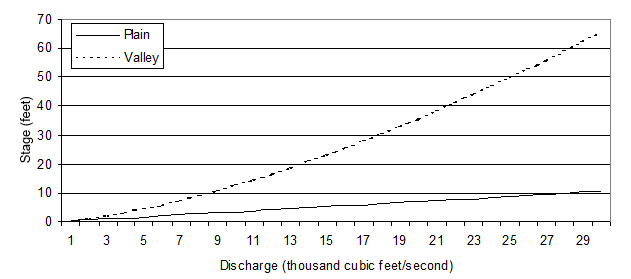
Floods are measured either by discharge or stage. Discharge, which is defined as the volume of water per unit of time, is the unit used by hydrologists. Stage, which is the height of water above a defined level, is the unit needed by emergency managers because flood stage determines the level of casualties and damage. Discharge is converted to stage by means of a rating curve (see Figure 5-2). The horizontal axis shows discharge in cubic feet per second and the vertical axis shows stage in feet above flood stage. Note that high rates of discharge produce much higher stages in a valley than on a plain because the valley walls confine the water.
Figure 5.2: Stage Rating Curve
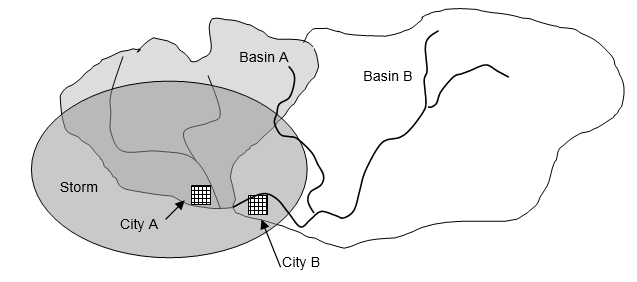
Flooding is affected by a number of factors. The first of these, precipitation, must be considered at a given point and also across the entire watershed (basin). The total precipitation at a point is equal to the duration of precipitation times its intensity (frequently measured in inches per hour). Total precipitation over a basin is equal to precipitation summed over all points in the surface area of the basin. The precipitation’s contribution to flooding is a function of temperature because rain (a liquid) is immediately available whereas snow (a solid) must first be melted by warm air or rain. Moreover, as indicated by Figure 5-3, the precipitation from a single storm might be deposited over two or more basins and the amount of rainfall in one basin might be quite different from that in the other basin. Consequently, there might be severe flooding in a town on one river (City A) and none at all in a town on another river (City B) even if the two towns received the same amount of rainfall from a storm.
As the hydrological cycle makes clear, flooding is also affected by surface runoff, which is determined by terrain and soil cover. One important aspect of terrain is its slope, with runoff increasing as slope increases. In addition to slope steepness, slope length and orientation to prevailing wind (and, thus, the accumulation of rainfall and snowfall) and sun (and, thus, the accumulation of snow) are also important determinants of flooding.
Figure 5.3: Map of the Distribution of Precipitation from a Storm
Slope geometry is also an important consideration. Divergent slopes (e.g., hills and ridges) provide rapid runoff dispersion. By contrast, convergent slopes (e.g., valleys) provide runoff storage in puddles, potholes, and ponds. Mixed slopes have combinations of these, so slope mean (the average slope angle) and variance (the variability of slope angles) determine the amount of storage. A slope with a zero mean and high variance (a plain with many potholes) will provide a larger amount of storage than a slope with a zero mean and low variance (a featureless plain). Similarly, a slope with a positive mean and high variance (a slope with many potholes) will provide a larger amount of storage than a slope with a positive mean and low variance.
Soil cover also affects flooding because dense low plant growth slows runoff and promotes infiltration. In areas with limited vegetation, surface permeability is a major determinant of flooding. Surface permeability increases with the proportion of organic matter content because this material absorbs water like a sponge. Permeability also is affected by surface texture (particle size and shape). Clay, stone, and concrete are very impermeable because particles are small and smooth, whereas gravel and sand are very permeable—especially when the particles are large and have irregular shapes that prevent them from compacting. Finally, surface permeability is affected by soil saturation because even permeable surfaces resist infiltration when soil pores (the spaces between soil particles that ordinarily are filled with air) become filled with water. Groundwater flows via local transport to streams at the foot of hill slopes and via remote transport through aquifers. Rapid in- and outflow through valley fill increases peak flows whereas very slow in- and outflow through upland areas maintains flows between rains.
Evapotranspiration takes place via two mechanisms. First, there is direct evaporation to atmosphere from surface storage in rivers and lakes. Second, there is uptake from soil and subsequent transpiration by plants. Transpiration draws moisture from the soil into plants’ roots, up through the stem, and out through the leaves’ pores (similar to people sweating). The latter mechanism is generally much higher in summer than in winter due to increased heat and plant growth, but transpiration is negligible during periods of high precipitation.
Stream channel flow is affected by channel wetting which infiltrates the stream banks (horizontally) until they are saturated as the water rises. In addition, there is seepage because porous channel bottoms allow water to infiltrate (vertically) into groundwater. Channel geometry also influences flow because a greater channel cross-section distributes the water over a greater area, as does the length of a reach (distinct section of river) because longer reaches provide greater water storage. High levels of discharge to downstream reaches can also affect flooding on upstream reaches because flooded downstream reaches slow flood transit by decreasing the river’s elevation drop.
Flooding increases when upstream areas experience deforestation and overgrazing, which increase surface runoff to a moderate degree on shallow slopes and to a major degree on steep slopes as the soil erodes. The sediment is washed downstream where it can silt the channel and raise the elevation of the river bottom. These problems of agricultural development are aggravated by flood plain urbanization. Like other cities throughout the world, US cities have been located in flood plains because water was the most efficient means of transportation until the mid-1800s. Consequently, many cities were located at the head of navigation or at transshipment points between rivers. In addition, cities have been located in flood plains because level alluvial soil is very easy to excavate for building foundations. Finally, urban development takes place in flood plains because of the aesthetic attraction of water. People enjoy seeing lakes and rivers, and pay a premium for real estate that is located there.
One consequence of urban development for flooding is that cities involve the replacement of vegetation with hardscape—impermeable surfaces such as building roofs, streets, and parking lots. This hardscape decreases soil infiltration, thus increasing the speed at which flood crests rise and fall. Another factor increasing flooding is intrusion into the flood plain by developers who fill intermittently flooded areas with soil to raise the elevation of the land. This decreases the channel cross-section, forcing the river to rise in other areas to compensate for the lost space.
Flood risk areas in the US are generally defined by the 100-year flood—an event that is expected to have a 100-year recurrence interval and, thus, a 1% chance of occurrence in any given year. It is important to understand that these extreme events are essentially independent, so it is possible for a community to experience two 100-year floods in the same century. Indeed, it is possible to have them in the same year even though that would be a very improbable event. This statistical principle is misunderstood by many people who believe there can be only one 100-year flood per century. The belief that a 100-year flood occurring this year cannot be repeated for another 100 years (or at least nearly 100 years) is a very dangerous fallacy. Moreover, a 100-year flood is an arbitrary standard of safety that reflects a compromise between the goals of providing long-term safety and developing economically valuable land. A 50-, 200-, or even a 500-year standard could be used instead. Community adoption of a 50-year flood standard would provide more area for residential, commercial, and industrial development. However, the resulting encroachment into the flood plain would lead to more frequent damaging floods than would a 100-year flood standard. Alternatively, a community might use different standards for different types of structures. For example, it might restrict the 100-year floodplain to low intensity uses (e.g., parks), allow residential housing to be constructed within the 500-year floodplain, and restrict nursing homes, hospitals, and schools to areas outside the 500-year floodplain.
Emergency response to floods is supported by prompt detection, which is local or regional in scope. This includes automated devices such as radar for assessing rainfall amounts at variable points in a watershed, rain gages for detecting rainfall amounts at predetermined points in a watershed, and stream gages for detecting water depth at predetermined points along a river. Detection also can be achieved by manual devices such as spotters for assessing rainfall amounts, water depth, or levee integrity at specific locations (planned before a flood or improvised during one). Once data on the quantity and distribution of precipitation have been collected, they are used to estimate discharge volumes over time from the runoff characteristics of a given watershed (e.g., soil permeability and surface steepness) at a given time (e.g., current soil saturation). Once discharge volume is estimated, it can be used together with downstream topography (e.g., mountain valley vs. plain) to predict downstream flood heights.
Timely and specific warnings of floods are provided by commercial news media as well as NOAA Weather Radio. The most appropriate protective action for persons is to evacuate in a direction perpendicular to the river channel. Because flash floods in mountain canyons can travel faster than a motor vehicle, it is safest to climb the canyon wall rather than try to drive out. It also is important to avoid crossing running water. Just two feet of fast moving water can float a car and push it downstream with 1000 pounds of force.
Storm Surge
Storm surge is an elevated water level that exceeds the height of normal astronomical tides. It is most commonly associated with hurricanes, but also can be caused by extratropical cyclones (nor’easters). The height of a storm surge increases as atmospheric pressure decreases and a storm’s maximum wind speed increases. Storm surge is especially significant where coastal topography and bathymetry (submarine topography) have shallow slopes and the coast has a narrowing shoreline that funnels the rising water. These factors are magnified when the storm remains stationary through several tide cycles and the affected coast is defined by low-lying barrier islands whose beaches and dunes have been eroded either by human development or by recent storms. Storm surge—together with astronomical high tide, rainfall, river flow, and storm surf—floods and batters structures and scours areas beneath foundations as much as 4-6 feet below the normal grade level. At one time, storm surge was the primary source of casualties in all countries, but inland flooding is now the primary cause of hurricanes deaths in the US. However, surge is still is the primary source of casualties in developing countries such as Bangladesh. In these countries, population pressure pushes the poor to farm highly vulnerable areas and poverty limits the development of dikes and seawalls, warning systems, evacuation transportation systems, and vertical shelters (wind resistant structures that are elevated above flood level).
Tsunamis
Tsunamis are commonly referred to as “tidal” waves but they are, in fact, sea waves that are usually generated by earthquakes. In addition, tsunamis can be caused by volcanic eruptions or landslides that usually, but not always, occur undersea. Tsunamis are rare events because 15,000 earthquakes over the course of a century have generated only 124 tsunamis, a rate of less than 1% of all earthquakes and only 0.7 tsunamis per year. This low rate of tsunami generation is attributable to earthquake intensity; two-thirds of all Pacific tsunamis are generated by shallow earthquakes exceeding 7.5 in magnitude.
Tsunamis can travel across thousands of miles of open ocean (e.g., from the Aleutians to Hawaii or from Chile to Japan) at speeds up to 400 mph in the open ocean, but they slow to 25 mph as they begin to break in shallow water and run up onto the land. Tsunamis are largely invisible in the open ocean because they are only 1-2 feet high. However, they have wave lengths up to 60 miles and periods as great as one hour. This contrasts significantly with ordinary ocean waves having wave heights up to 30 feet, wave lengths of about 500 feet, and periods of about 10 seconds. Tsunamis can have devastating effects in some of the places where they make landfall because the waves encounter bottom friction when the water depth is less than 1/20 of their wavelength. At this point, the bottom of the wave front slows and is overtaken by the rest of the wave, which must rise over it. For example, when a wave reaches a depth of 330 feet, its speed is reduced from 400 mph to 60 mph. Later, reaching a depth of 154 feet reduces its speed to 44 mph. This causes the next 650 feet of the wave to overtake the wave front in a single second. As the wave continues shoreward, each succeeding segment of the wave must rise above the previous segment because it can’t go down (water is not compressible) or back (the rest of the wave is pressing it forward). Because the wavelength is so long and wave speed is so fast, a large volume of water can pile up to a very great height—especially where the continental shelf is very narrow. It is important to note that the initial cue to tsunami arrival might be that the water level drops, rather than rises. Indeed, this was the case in the 2004 Indian Ocean tsunami. People’s failure to understand the significance of the receding water contributed to a death toll exceeding 200,000. An initial wave is created only if the seafloor rises suddenly, whereas an initial trough is created if the seafloor drops. In either case, the initial phase will be followed by the alternate phase (i.e., a wave is followed by a trough or vice-versa).
Tsunamis threaten shorelines worldwide and have no known temporal (i.e., diurnal or seasonal) variation. If a tsunami is initiated locally (i.e., within a hundred miles), the potential for a tsunami can be detected by severe earthquake shaking. However, coastal residents’ only physical cue to a remotely initiated tsunami is wave arrival at coast, although the arrival of a trough (making it appear that the tide went out unexpectedly) should be recognized as a danger sign. International tsunami warning systems base their detection of remote tsunamis on seismic monitoring to detect major earthquakes and tidal gauges located throughout the Pacific basin to verify tsunami generation. Once tsunami generation has been confirmed, alerts can be transmitted throughout the Pacific basin. The need for prompt action can be inferred from tsunami’s forward movement speed; a tsunami generated 100 miles away from a coast can arrive in about 15 minutes.
The physical magnitude of a tsunami is extremely impressive. Wave crests can arrive at 10-45 minute intervals for up to six hours and the highest wave, as much as 100 ft at the shoreline, can be anywhere in the wave train. The area flooded by a tsunami is known as the inundation zone, which equivalent to a 100-year floodplain or hurricane storm surge risk area. Because of the complexities in accounting for wave behavior and the characteristics of the offshore bathymetry and onshore topography, tsunami inundation zones must be calculated by competent analysts using sophisticated computer programs. The physical impacts include casualties caused by deaths from drowning and traumatic injuries from wave impact. Property damage is caused by the same mechanisms.
Regarding protective measures, sheltering in-place in elevated structures can protect against surge. However, steel reinforced concrete structures on deep pilings are required to withstand wave battering and foundation scour. Consequently, evacuation to higher ground is the most effective method of population protection. Evacuation to a safe distance out of the runup zone is obviously difficult on low-lying coasts, but it also can be difficult where there are nearby hills if the primary evacuation route runs parallel to the coastline.