
5.12.10: Access Reports
- Page ID
- 14820
Utilizing Access to analyze data results in lots of information. This Information needs to be shared – often will people who do not, or should not, have rights to utilize the Access database. Access reports organize and present data in a reader-friendly, visually appealing format by using data from any queries or tables in the database. The tables or queries that provide the underlying data are also known as the report’s record source. A report is a database object that comes in handy when you want to present the information in your database for any of the following uses:
- Display or distribute a summary of data.
- Archive historical information.
- Provide details about individual records.
- Create labels.
There are four different report views in Access. Two are essentially print views and the other two are report building views. As with all other Access objects, you can toggle the view using the buttons at the bottom right of the screen, or by using the View button on the Ribbon. The four views include:
- Report view – shows how a report would appear with dummy data using a continuous page layout.
- Print Preview – allows users to see what the report will look like when printed. This view can be used to change the page layout, including the report orientation.
- Layout view – allows users to edit the report design while it contains live data. Considered the most intuitive view to use for report modification, this view can be used for nearly all potential changes to a report in Access.
- Design view – allows users to view and change any aspect of the report structure, but not the data. This view displays any expressions that are used to generate content, and displays the header and footer bands for the report, page, and groups.. This is the preferred view for adding controls to the report, such as labels, images, lines and rectangles.
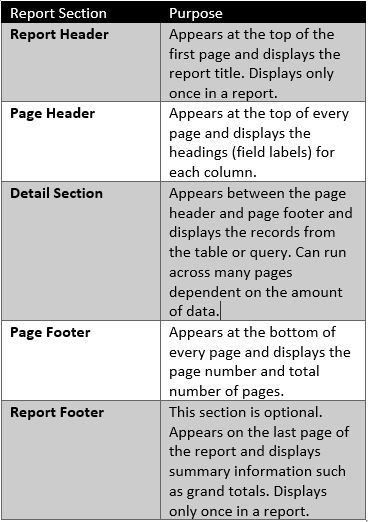
The design of a report is divided into sections that can be modified in the Design view. Reports created by using the Report button are plain and simple, and have several sections, as detailed in the table to the right. More complex reports created using the Report Wizard can also have multiple group header and group footer sections to print grouping details and summary information.
Reports can be designed and formatted in a similar way to forms. When you create a report, four new tabs appear in the Report Layout Tools section of the Ribbon specifically for working with reports.
- Design: Group and sort elements in the report, add text and links, insert page numbers, and modify the sheet’s properties.
- Arrange: Adjust the table to be stacked, tabular, etc.; move rows and columns up an down or left and right; merge and split columns and rows; control the margins and bring elements to the “front” or “back” in a layering format.
- Format: Includes regular word processor formatting tools like bold, italic, underline, text and background color, number and date formatting, conditional formatting, etc.
- Page Setup: Allows adjusting of the page’s overall size and toggling between landscape and portrait.
Another popular approach to creating reports is to use the Access Report Wizard. The Report Wizard provides more flexibility than by simply using the Report button. The Report Wizard guides users through a series of questions and then generates a report based on these answers. Users can choose the tables and fields, group the data, sort the data, summarize the data, choose a layout and orientation, apply a style, and title the report. Grouping data puts all of the values in a field into a group based on the field’s value. By using the Report Wizard, users can create up to four sort levels. If the data has been grouped, the option exists to summarize the data by displaying the sum, average, and minimum or maximum value for each numeric field. Choose to have the report display just the summary data or each detail line and the summary data. Note: Users can also add grouping, sorting, or totals by using the Group, Sort, and Total pane while the report is open in Layout view or Design view.
To print a report, right-click the report in the Navigation Pane and choose Print Preview from the shortcut menu. Print Preview command options include:
- Print the report
- Adjust page size, margins or orientation
- Zoom in or out, or view multiple pages at a time
- Refresh the data on the report
- Export the report to another file format.
To save paper, or to send a print job to a professional printer, or send the report via e-mail, you can create a .pdf or xps format of your report: On the Print Preview tab, in the Data group, click PDF or XPS. Reports can be saved as an object in the Navigation Pane, and at later date, updated and re-printed. Unlike Access queries, the page settings are maintained in Access reports when saved.