7.2: Theory of Visual Perception and Preattentive Attributes
- Page ID
- 48080

\( \newcommand{\vecs}[1]{\overset { \scriptstyle \rightharpoonup} {\mathbf{#1}} } \)
\( \newcommand{\vecd}[1]{\overset{-\!-\!\rightharpoonup}{\vphantom{a}\smash {#1}}} \)
\( \newcommand{\dsum}{\displaystyle\sum\limits} \)
\( \newcommand{\dint}{\displaystyle\int\limits} \)
\( \newcommand{\dlim}{\displaystyle\lim\limits} \)
\( \newcommand{\id}{\mathrm{id}}\) \( \newcommand{\Span}{\mathrm{span}}\)
( \newcommand{\kernel}{\mathrm{null}\,}\) \( \newcommand{\range}{\mathrm{range}\,}\)
\( \newcommand{\RealPart}{\mathrm{Re}}\) \( \newcommand{\ImaginaryPart}{\mathrm{Im}}\)
\( \newcommand{\Argument}{\mathrm{Arg}}\) \( \newcommand{\norm}[1]{\| #1 \|}\)
\( \newcommand{\inner}[2]{\langle #1, #2 \rangle}\)
\( \newcommand{\Span}{\mathrm{span}}\)
\( \newcommand{\id}{\mathrm{id}}\)
\( \newcommand{\Span}{\mathrm{span}}\)
\( \newcommand{\kernel}{\mathrm{null}\,}\)
\( \newcommand{\range}{\mathrm{range}\,}\)
\( \newcommand{\RealPart}{\mathrm{Re}}\)
\( \newcommand{\ImaginaryPart}{\mathrm{Im}}\)
\( \newcommand{\Argument}{\mathrm{Arg}}\)
\( \newcommand{\norm}[1]{\| #1 \|}\)
\( \newcommand{\inner}[2]{\langle #1, #2 \rangle}\)
\( \newcommand{\Span}{\mathrm{span}}\) \( \newcommand{\AA}{\unicode[.8,0]{x212B}}\)
\( \newcommand{\vectorA}[1]{\vec{#1}} % arrow\)
\( \newcommand{\vectorAt}[1]{\vec{\text{#1}}} % arrow\)
\( \newcommand{\vectorB}[1]{\overset { \scriptstyle \rightharpoonup} {\mathbf{#1}} } \)
\( \newcommand{\vectorC}[1]{\textbf{#1}} \)
\( \newcommand{\vectorD}[1]{\overrightarrow{#1}} \)
\( \newcommand{\vectorDt}[1]{\overrightarrow{\text{#1}}} \)
\( \newcommand{\vectE}[1]{\overset{-\!-\!\rightharpoonup}{\vphantom{a}\smash{\mathbf {#1}}}} \)
\( \newcommand{\vecs}[1]{\overset { \scriptstyle \rightharpoonup} {\mathbf{#1}} } \)
\(\newcommand{\longvect}{\overrightarrow}\)
\( \newcommand{\vecd}[1]{\overset{-\!-\!\rightharpoonup}{\vphantom{a}\smash {#1}}} \)
\(\newcommand{\ket}[1]{\left| #1 \right>}\)
\(\newcommand{\bra}[1]{\left< #1 \right|}\)
\(\newcommand{\braket}[2]{\left< #1 \vphantom{#2} \right| \left. #2 \vphantom{#1} \right>}\)
\(\newcommand{\braopket}[3]{\left< #1 \vphantom{#2}\vphantom{#3} \right| #2 \vphantom{#1}\vphantom{#3} \left| #3 \vphantom{#1}\vphantom{#2} \right>}\)
\(\newcommand{\qmvec}[1]{\mathbf{\vec{#1}}}\)
\(\newcommand{\op}[1]{\hat{\mathbf{#1}}}\)
\(\newcommand{\expect}[1]{\langle #1 \rangle}\)
\(\newcommand{\dfn}[1]{\emph{\textbf{#1}}}\)
Theory of Visual Perception and Preattentive Attributes
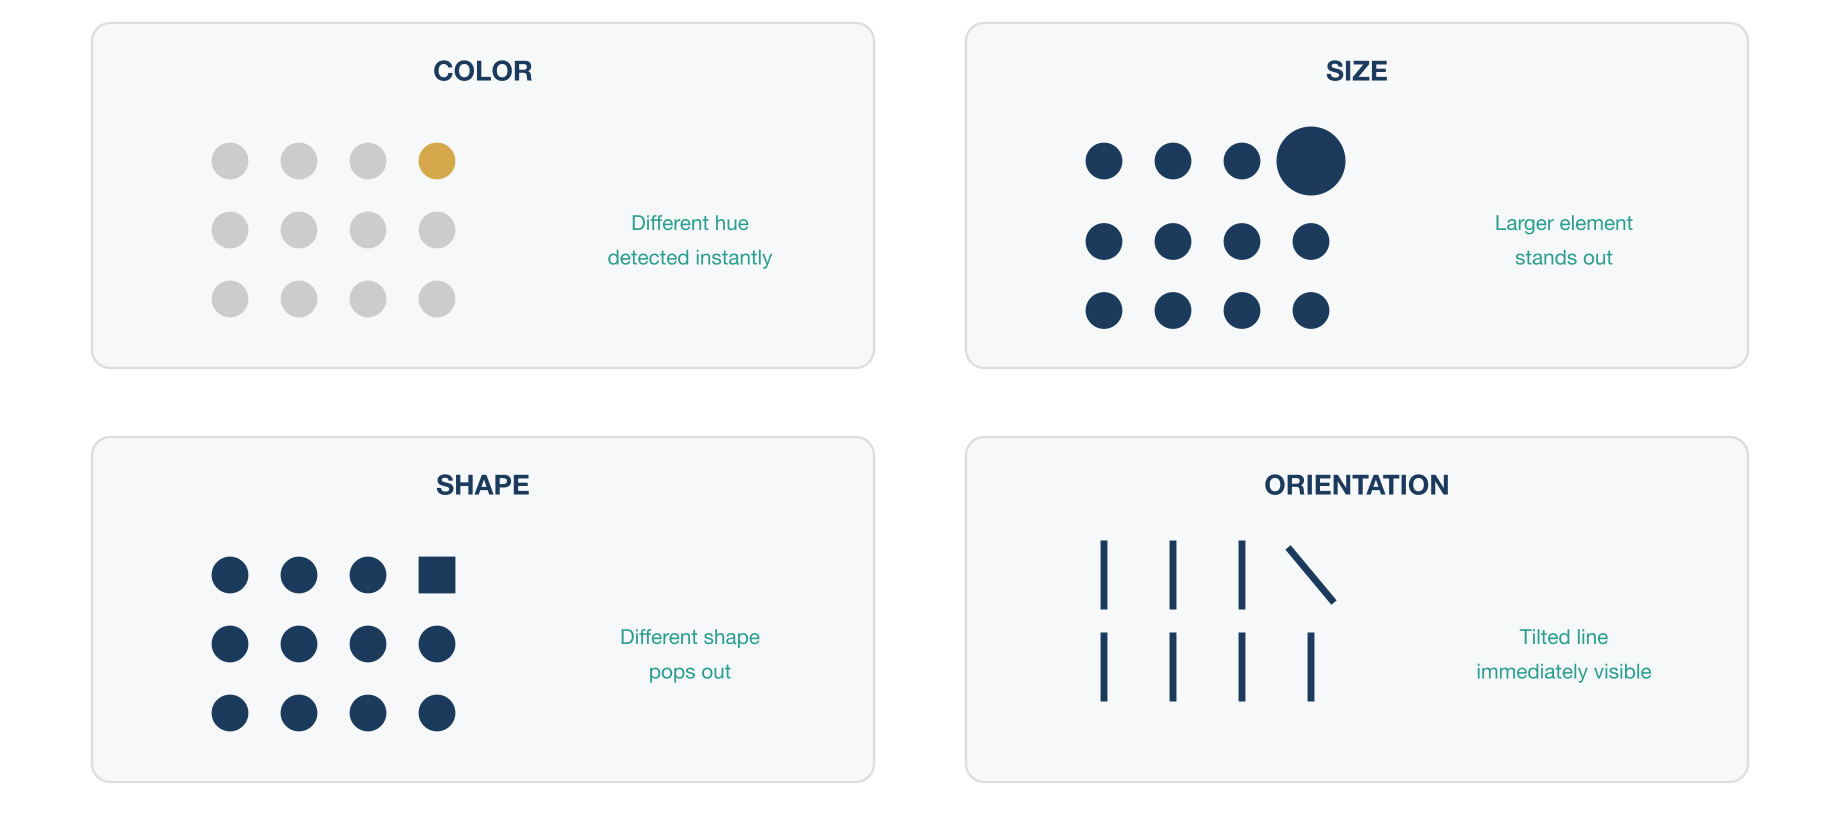
To design effective visualizations, it helps to understand how human visual perception works. Our eyes and brain work together to process visual information extremely quickly, especially certain basic visual features. These immediately-noticed features are known as preattentive attributes. A preattentive attribute is a visual property that the brain processes in under 500 milliseconds, without conscious effort. In other words, before you even actively think about what you’re seeing, your sensory memory has picked up on these cues [3]. This is great news for data visualization, because by leveraging preattentive attributes, we can direct the audience’s attention to important details almost instantly.
Common preattentive visual attributes include color, form, and motion. For example, if one bar in a chart is colored bright red while all others are gray, that red bar will immediately stand out. Color (hue and intensity) is a powerful preattentive attribute – our brains quickly notice a different color or a more intense shade without any conscious comparison. Form refers to properties like shape, size, orientation, and length. A much longer bar in a bar chart, a differently shaped marker in a scatter plot, or a data point with a larger size will draw attention automatically. Position in space is also processed preattentively; for instance, an object isolated far from others on a plot will catch the eye. Motion (or flicker) can seize attention as well, though it should be used sparingly in visualization to avoid distraction [4].
By understanding preattentive attributes, analysts can design charts that highlight key insights effectively. For example, when presenting a finding, you might use a distinct color to emphasize the most important data point, ensuring the viewer notices it first. Preattentive processing is essentially leveraging our brain’s pattern-seeking hardware. In summary, smart use of visual cues like color, size, and shape in your charts can significantly improve clarity and focus, guiding your audience to the insights “at a glance.” (We’ll see examples of this in practice in later sections.)