

9.6: Presenting to Different Audiences - Technical vs. Executive
- Page ID
- 48106

\( \newcommand{\vecs}[1]{\overset { \scriptstyle \rightharpoonup} {\mathbf{#1}} } \)
\( \newcommand{\vecd}[1]{\overset{-\!-\!\rightharpoonup}{\vphantom{a}\smash {#1}}} \)
\( \newcommand{\dsum}{\displaystyle\sum\limits} \)
\( \newcommand{\dint}{\displaystyle\int\limits} \)
\( \newcommand{\dlim}{\displaystyle\lim\limits} \)
\( \newcommand{\id}{\mathrm{id}}\) \( \newcommand{\Span}{\mathrm{span}}\)
( \newcommand{\kernel}{\mathrm{null}\,}\) \( \newcommand{\range}{\mathrm{range}\,}\)
\( \newcommand{\RealPart}{\mathrm{Re}}\) \( \newcommand{\ImaginaryPart}{\mathrm{Im}}\)
\( \newcommand{\Argument}{\mathrm{Arg}}\) \( \newcommand{\norm}[1]{\| #1 \|}\)
\( \newcommand{\inner}[2]{\langle #1, #2 \rangle}\)
\( \newcommand{\Span}{\mathrm{span}}\)
\( \newcommand{\id}{\mathrm{id}}\)
\( \newcommand{\Span}{\mathrm{span}}\)
\( \newcommand{\kernel}{\mathrm{null}\,}\)
\( \newcommand{\range}{\mathrm{range}\,}\)
\( \newcommand{\RealPart}{\mathrm{Re}}\)
\( \newcommand{\ImaginaryPart}{\mathrm{Im}}\)
\( \newcommand{\Argument}{\mathrm{Arg}}\)
\( \newcommand{\norm}[1]{\| #1 \|}\)
\( \newcommand{\inner}[2]{\langle #1, #2 \rangle}\)
\( \newcommand{\Span}{\mathrm{span}}\) \( \newcommand{\AA}{\unicode[.8,0]{x212B}}\)
\( \newcommand{\vectorA}[1]{\vec{#1}} % arrow\)
\( \newcommand{\vectorAt}[1]{\vec{\text{#1}}} % arrow\)
\( \newcommand{\vectorB}[1]{\overset { \scriptstyle \rightharpoonup} {\mathbf{#1}} } \)
\( \newcommand{\vectorC}[1]{\textbf{#1}} \)
\( \newcommand{\vectorD}[1]{\overrightarrow{#1}} \)
\( \newcommand{\vectorDt}[1]{\overrightarrow{\text{#1}}} \)
\( \newcommand{\vectE}[1]{\overset{-\!-\!\rightharpoonup}{\vphantom{a}\smash{\mathbf {#1}}}} \)
\( \newcommand{\vecs}[1]{\overset { \scriptstyle \rightharpoonup} {\mathbf{#1}} } \)
\(\newcommand{\longvect}{\overrightarrow}\)
\( \newcommand{\vecd}[1]{\overset{-\!-\!\rightharpoonup}{\vphantom{a}\smash {#1}}} \)
\(\newcommand{\ket}[1]{\left| #1 \right>}\)
\(\newcommand{\bra}[1]{\left< #1 \right|}\)
\(\newcommand{\braket}[2]{\left< #1 \vphantom{#2} \right| \left. #2 \vphantom{#1} \right>}\)
\(\newcommand{\braopket}[3]{\left< #1 \vphantom{#2}\vphantom{#3} \right| #2 \vphantom{#1}\vphantom{#3} \left| #3 \vphantom{#1}\vphantom{#2} \right>}\)
\(\newcommand{\qmvec}[1]{\mathbf{\vec{#1}}}\)
\(\newcommand{\op}[1]{\hat{\mathbf{#1}}}\)
\(\newcommand{\expect}[1]{\langle #1 \rangle}\)
\(\newcommand{\dfn}[1]{\emph{\textbf{#1}}}\)
Presenting to Different Audiences - Technical vs. Executive
One of the final steps in data storytelling is the actual presentation of the insights, which often involves tailoring the delivery to the audience. A common distinction is between technical audiences (e.g., data scientists, engineers, analysts) and executive or non-technical audiences (e.g., C-suite leaders, business managers, clients without technical background). Each group has different priorities and ways of consuming information, so the same analysis needs to be presented differently to maximize impact for each.
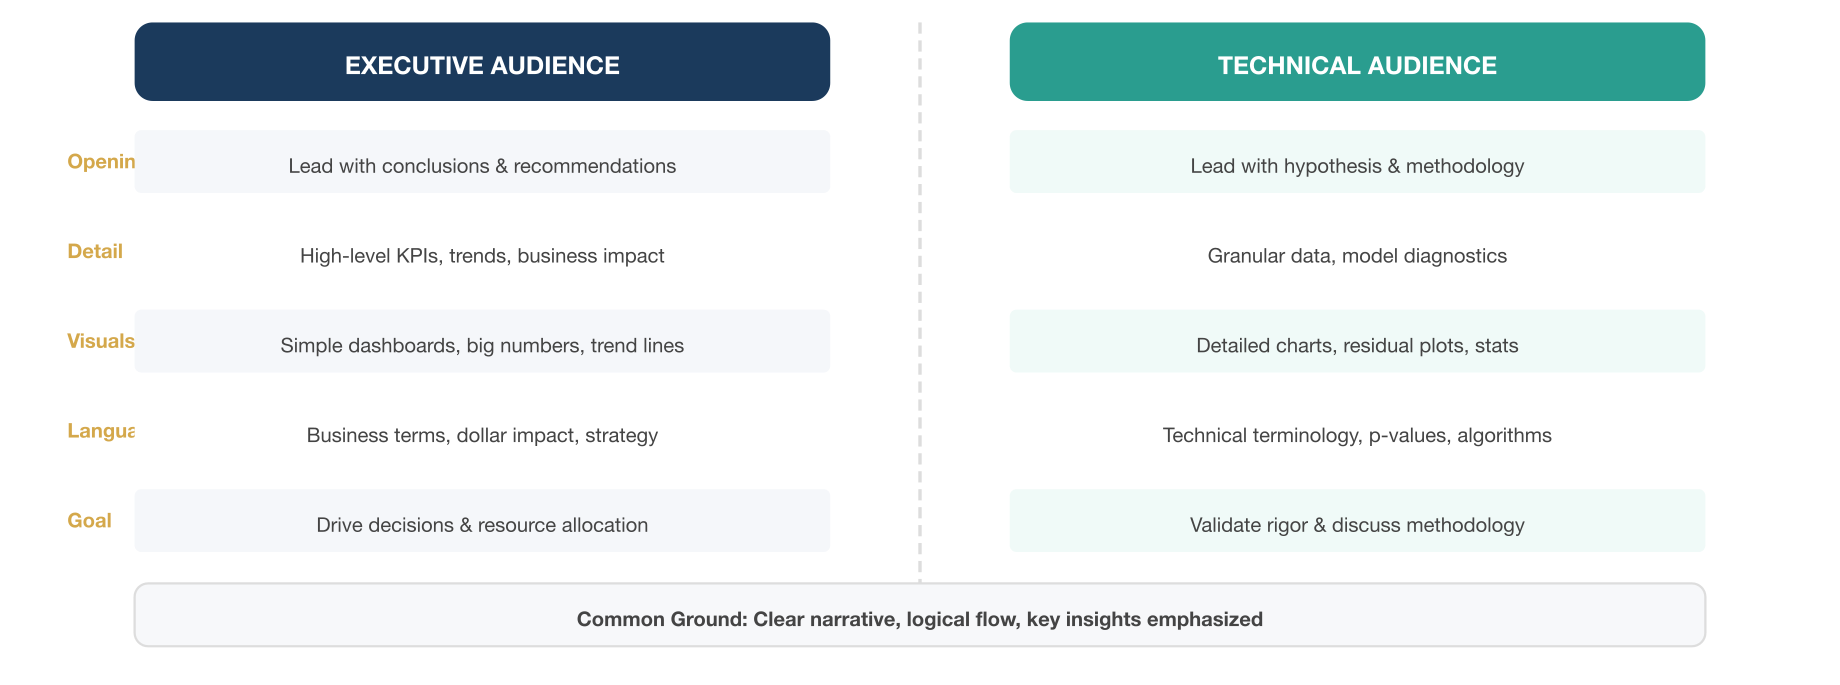
Executive Audiences: Executives are typically time-constrained and focused on high-level outcomes and decisions. They care about the so-what – the business implications, the ROI, the risks, the opportunities. When presenting data to executives: - Lead with conclusions and recommendations. Don’t bury the lead; start with the key insight or summary finding (often called the “executive summary”). For example: “Our analysis shows a 10% drop in customer acquisition cost after the new marketing strategy, which will save us $500k annually.” This way, even if time is cut short, the most important message is delivered. - Use simple, high-impact visuals. Executives don’t need to see every data point – they want a clear picture. Charts should be uncluttered and emphasize trends or comparisons directly relevant to decisions. They often appreciate visuals like KPI dashboards, trend lines with clear annotations, or a succinct table of key metrics (not a huge spreadsheet). An executive might prefer a one-page dashboard or slide that tells the whole story at a glance, with supporting details verbally explained or in an appendix. - Avoid jargon and too much technical detail. Use business language and contextualize metrics in terms of business goals. Instead of “heteroscedasticity test” say “we checked that the variability was stable so our model is reliable.” Focus on insights, not methods. Executives generally trust that the team did due diligence on methods; they want the punchline and what you propose to do about it. - Emphasize implications and actions. For everything you show, answer “What does this mean for the business?” and “What should we do?” For instance: “This decline in churn means we retain 200 more customers per quarter, translating to approximately $2M in additional annual revenue. We recommend reinvesting part of this gain into further improving customer support, which is the likely driver of this improvement.” Executives appreciate connecting data to strategy and dollars. - Be prepared for big-picture questions. Executives might zoom out: “What’s driving this trend? How does this compare to competitors? What’s the risk if we do nothing?” So, while not diving into technical minutiae, be ready to relate your findings to the broader context. Often, including a slide on “Key Drivers” or a high-level root cause analysis helps answer these questions proactively.
Technical Audiences: Technical folks, such as analysts or engineers, are interested in the how behind the results. They value rigor, methodology, and may even want to debate analytical choices. - Provide sufficient detail and data. When presenting to technical peers, it’s appropriate to show more of the analytic process: the data sources, sample size, any data cleansing steps, the statistical methods or models used, and validation results. They will appreciate a clear explanation of methodology (perhaps in flowcharts or schematic diagrams) and maybe some diagnostic visuals (like model fit charts, residual plots, etc., if relevant). - Use appropriate terminology (but explain if needed). With technical audiences, you can use jargon and abbreviations common to your field (e.g., talk about p-values, confidence intervals, algorithm names) because it builds credibility that you know your stuff. However, ensure everyone in that technical audience has the same understanding – if cross-functional (like a data scientist, an engineer, and a product manager together), might need to clarify domain-specific terms. - Discuss assumptions and limitations. Technical colleagues will want to know if the analysis is robust. A savvy technical audience almost expects a “limitations” slide or at least an acknowledgment of uncertainty. For example: “These projections assume a stable market environment and no new competitors – if those change, our model would need updating.” A technical group might even appreciate a brief mention of alternative approaches you considered and why you chose the current one. - Encourage questions and deep dive. With technical teams, the presentation can be more of a working session. They might interrupt with questions about a certain data point or request to see a different cut of the data. Be prepared with backup slides or the ability to show the raw data if needed. In some cases, a live demo of an interactive analysis or dashboard is appropriate, so the group can explore specific points of interest together. - Highlight insights with the data story. Technical folks still need the story, but you can spend more time on how the data supports it. For example, they would be interested in a sequence like: “We hypothesized X, we tested with method Y, here are the results (chart) – which confirm X, leading to insight Z.” They’ll appreciate the logical flow and evidence. You might involve them in interpreting charts – e.g., “Here’s the trend after the new software deployment, do you see how the latency dropped? We believe that’s due to the code optimization in release 4.2.” (They might nod and add context, creating a richer discussion.)
Tailoring in Practice: Consider a scenario – you have analyzed system downtime causes for a tech company. To the CTO (executive), you’d present: “System downtime was reduced by 40% last quarter, mainly due to infrastructure upgrades. However, 70% of remaining downtime is caused by one legacy service. Recommendation: allocate resources to refactor that service, which could potentially save $100k/month in lost revenue from downtime.” You’d show maybe one pie chart of downtime causes and a dollar impact summary. Discussion would be around resource allocation and risk.
To the engineering team (technical), you’d show a more detailed breakdown: time-series of downtimes, annotated with deployment events, maybe a table of top 10 incidents with root causes, and analysis of patterns (time of day, load conditions). You’d discuss technical root causes (memory leak, network config error, etc.). You might dive into logs or monitoring data visuals. The team’s discussion would revolve around technical fixes, maybe verifying your interpretation of causes, or brainstorming solutions (like “we see a spike at 2am due to backup jobs – maybe reschedule them”).
Another dimension is interactivity and engagement in presentation: Executives might prefer a concise slide deck or a dashboard that they can quickly scan; technical audiences might actually engage with a live notebook or an interactive dashboard in real-time. For example, with a technical crowd, you could bring up a Plotly Dash app and adjust parameters live to show how outcomes change – this transparency can build trust and interest. With executives, such a live exploration might be less effective (they could get lost or it might deviate from the core message); instead, give them a polished story with clear visuals.
Regardless of audience, some common best practices apply: tell a story, be clear and logical, and focus on key points. But the level of detail, the framing of benefits, and the communication style should shift. Technical audiences are generally more patient with detail and complexity (in fact, they desire it) and they are often persuaded by evidence. Executive audiences require you to be succinct and persuade by implications, tying data to business value. One might say executives want the headline, technical people want the full article (and maybe the appendix too).
It’s also worth noting that there are audiences in between – for example, a marketing manager might not be a data scientist but is data-literate; you’d tailor the story to focus on marketing implications, using some data but not overwhelming with statistical detail. Knowing your specific audience’s data comfort level is key. When in doubt, lean towards clarity: it’s safer to slightly over-explain than under-explain. But with executives, do so in appendices or Q&A rather than the main narrative, to maintain a crisp delivery.
In conclusion, audience tailoring is crucial: A data story should be molded to fit who is listening. This might even involve creating separate deliverables – an executive summary and a technical report – from the same analysis. By aligning your language, visuals, and focus with the audience’s perspective, you ensure the message lands effectively. This way, both the CEO and the data engineer walk away informed and convinced, each getting what they needed from the data story.