
1.4: Emissions of NOx
- Page ID
- 10932

\( \newcommand{\vecs}[1]{\overset { \scriptstyle \rightharpoonup} {\mathbf{#1}} } \)
\( \newcommand{\vecd}[1]{\overset{-\!-\!\rightharpoonup}{\vphantom{a}\smash {#1}}} \)
\( \newcommand{\id}{\mathrm{id}}\) \( \newcommand{\Span}{\mathrm{span}}\)
( \newcommand{\kernel}{\mathrm{null}\,}\) \( \newcommand{\range}{\mathrm{range}\,}\)
\( \newcommand{\RealPart}{\mathrm{Re}}\) \( \newcommand{\ImaginaryPart}{\mathrm{Im}}\)
\( \newcommand{\Argument}{\mathrm{Arg}}\) \( \newcommand{\norm}[1]{\| #1 \|}\)
\( \newcommand{\inner}[2]{\langle #1, #2 \rangle}\)
\( \newcommand{\Span}{\mathrm{span}}\)
\( \newcommand{\id}{\mathrm{id}}\)
\( \newcommand{\Span}{\mathrm{span}}\)
\( \newcommand{\kernel}{\mathrm{null}\,}\)
\( \newcommand{\range}{\mathrm{range}\,}\)
\( \newcommand{\RealPart}{\mathrm{Re}}\)
\( \newcommand{\ImaginaryPart}{\mathrm{Im}}\)
\( \newcommand{\Argument}{\mathrm{Arg}}\)
\( \newcommand{\norm}[1]{\| #1 \|}\)
\( \newcommand{\inner}[2]{\langle #1, #2 \rangle}\)
\( \newcommand{\Span}{\mathrm{span}}\) \( \newcommand{\AA}{\unicode[.8,0]{x212B}}\)
\( \newcommand{\vectorA}[1]{\vec{#1}} % arrow\)
\( \newcommand{\vectorAt}[1]{\vec{\text{#1}}} % arrow\)
\( \newcommand{\vectorB}[1]{\overset { \scriptstyle \rightharpoonup} {\mathbf{#1}} } \)
\( \newcommand{\vectorC}[1]{\textbf{#1}} \)
\( \newcommand{\vectorD}[1]{\overrightarrow{#1}} \)
\( \newcommand{\vectorDt}[1]{\overrightarrow{\text{#1}}} \)
\( \newcommand{\vectE}[1]{\overset{-\!-\!\rightharpoonup}{\vphantom{a}\smash{\mathbf {#1}}}} \)
\( \newcommand{\vecs}[1]{\overset { \scriptstyle \rightharpoonup} {\mathbf{#1}} } \)
\( \newcommand{\vecd}[1]{\overset{-\!-\!\rightharpoonup}{\vphantom{a}\smash {#1}}} \)
\(\newcommand{\avec}{\mathbf a}\) \(\newcommand{\bvec}{\mathbf b}\) \(\newcommand{\cvec}{\mathbf c}\) \(\newcommand{\dvec}{\mathbf d}\) \(\newcommand{\dtil}{\widetilde{\mathbf d}}\) \(\newcommand{\evec}{\mathbf e}\) \(\newcommand{\fvec}{\mathbf f}\) \(\newcommand{\nvec}{\mathbf n}\) \(\newcommand{\pvec}{\mathbf p}\) \(\newcommand{\qvec}{\mathbf q}\) \(\newcommand{\svec}{\mathbf s}\) \(\newcommand{\tvec}{\mathbf t}\) \(\newcommand{\uvec}{\mathbf u}\) \(\newcommand{\vvec}{\mathbf v}\) \(\newcommand{\wvec}{\mathbf w}\) \(\newcommand{\xvec}{\mathbf x}\) \(\newcommand{\yvec}{\mathbf y}\) \(\newcommand{\zvec}{\mathbf z}\) \(\newcommand{\rvec}{\mathbf r}\) \(\newcommand{\mvec}{\mathbf m}\) \(\newcommand{\zerovec}{\mathbf 0}\) \(\newcommand{\onevec}{\mathbf 1}\) \(\newcommand{\real}{\mathbb R}\) \(\newcommand{\twovec}[2]{\left[\begin{array}{r}#1 \\ #2 \end{array}\right]}\) \(\newcommand{\ctwovec}[2]{\left[\begin{array}{c}#1 \\ #2 \end{array}\right]}\) \(\newcommand{\threevec}[3]{\left[\begin{array}{r}#1 \\ #2 \\ #3 \end{array}\right]}\) \(\newcommand{\cthreevec}[3]{\left[\begin{array}{c}#1 \\ #2 \\ #3 \end{array}\right]}\) \(\newcommand{\fourvec}[4]{\left[\begin{array}{r}#1 \\ #2 \\ #3 \\ #4 \end{array}\right]}\) \(\newcommand{\cfourvec}[4]{\left[\begin{array}{c}#1 \\ #2 \\ #3 \\ #4 \end{array}\right]}\) \(\newcommand{\fivevec}[5]{\left[\begin{array}{r}#1 \\ #2 \\ #3 \\ #4 \\ #5 \\ \end{array}\right]}\) \(\newcommand{\cfivevec}[5]{\left[\begin{array}{c}#1 \\ #2 \\ #3 \\ #4 \\ #5 \\ \end{array}\right]}\) \(\newcommand{\mattwo}[4]{\left[\begin{array}{rr}#1 \amp #2 \\ #3 \amp #4 \\ \end{array}\right]}\) \(\newcommand{\laspan}[1]{\text{Span}\{#1\}}\) \(\newcommand{\bcal}{\cal B}\) \(\newcommand{\ccal}{\cal C}\) \(\newcommand{\scal}{\cal S}\) \(\newcommand{\wcal}{\cal W}\) \(\newcommand{\ecal}{\cal E}\) \(\newcommand{\coords}[2]{\left\{#1\right\}_{#2}}\) \(\newcommand{\gray}[1]{\color{gray}{#1}}\) \(\newcommand{\lgray}[1]{\color{lightgray}{#1}}\) \(\newcommand{\rank}{\operatorname{rank}}\) \(\newcommand{\row}{\text{Row}}\) \(\newcommand{\col}{\text{Col}}\) \(\renewcommand{\row}{\text{Row}}\) \(\newcommand{\nul}{\text{Nul}}\) \(\newcommand{\var}{\text{Var}}\) \(\newcommand{\corr}{\text{corr}}\) \(\newcommand{\len}[1]{\left|#1\right|}\) \(\newcommand{\bbar}{\overline{\bvec}}\) \(\newcommand{\bhat}{\widehat{\bvec}}\) \(\newcommand{\bperp}{\bvec^\perp}\) \(\newcommand{\xhat}{\widehat{\xvec}}\) \(\newcommand{\vhat}{\widehat{\vvec}}\) \(\newcommand{\uhat}{\widehat{\uvec}}\) \(\newcommand{\what}{\widehat{\wvec}}\) \(\newcommand{\Sighat}{\widehat{\Sigma}}\) \(\newcommand{\lt}{<}\) \(\newcommand{\gt}{>}\) \(\newcommand{\amp}{&}\) \(\definecolor{fillinmathshade}{gray}{0.9}\)Learning Objectives
Operate the Plant at full generating capacity and compare the NOx emissions when the plant is operating:
- Under normal conditions,
- During over fire air damper failure,
- During over burner air control failure,
- Burning poor quality fuel,
- With the DeNOx plant bypassed.
Theory
Combustion of coal generates considerable quantities of byproducts, some of which are considered pollutants. The byproducts are mostly water vapor which is what we see coming out of a power plant smokestack, carbon dioxide, and nitrogen that is readily available in the air we breathe, and they do not necessarily pose any direct health hazard. However, the emissions do carry small concentrations of pollutants into the atmosphere, which translate into large quantities of hazardous emissions due to the large amount of coal combusted. The main pollutants that can cause health problems are sulfur oxides, nitrogen oxides, particulate matter (see Combustion Analysis) and such trace elements as arsenic, lead and mercury.
During the combustion process in a coal-fired power plant, nitrogen from the coal and air is converted into nitric oxide (NO) and nitrogen dioxide (NO2); these nitrogen oxides are commonly known as NOx. NOx emissions contribute to the formation of acid rain.
NOx is primarily formed by two mechanisms: thermal NOx and fuel-bound NOx.
Thermal NOx formation takes place at high flame temperatures. Formation of thermal NOx increases exponentially with combustion temperature. Fuel-bound NOx formation is dependent upon the nitrogen content of the fuel.
The best way to minimize NOx formation is to reduce flame temperature, reduce excess oxygen, and/or to burn low nitrogen-containing fuels.
The DeNOx Plant Description
The purpose of the DeNOx plant is for removal of nitrogen oxide from the flue gases. The plant employs a selective catalytic reduction method. The medium used for the reduction is ammonia gas.
The DeNOx plant includes two selective catalytic reduction (SCR) reactors and an ash silo. Various dampers channel the flue gases either into or bypass the SCR-reactors.
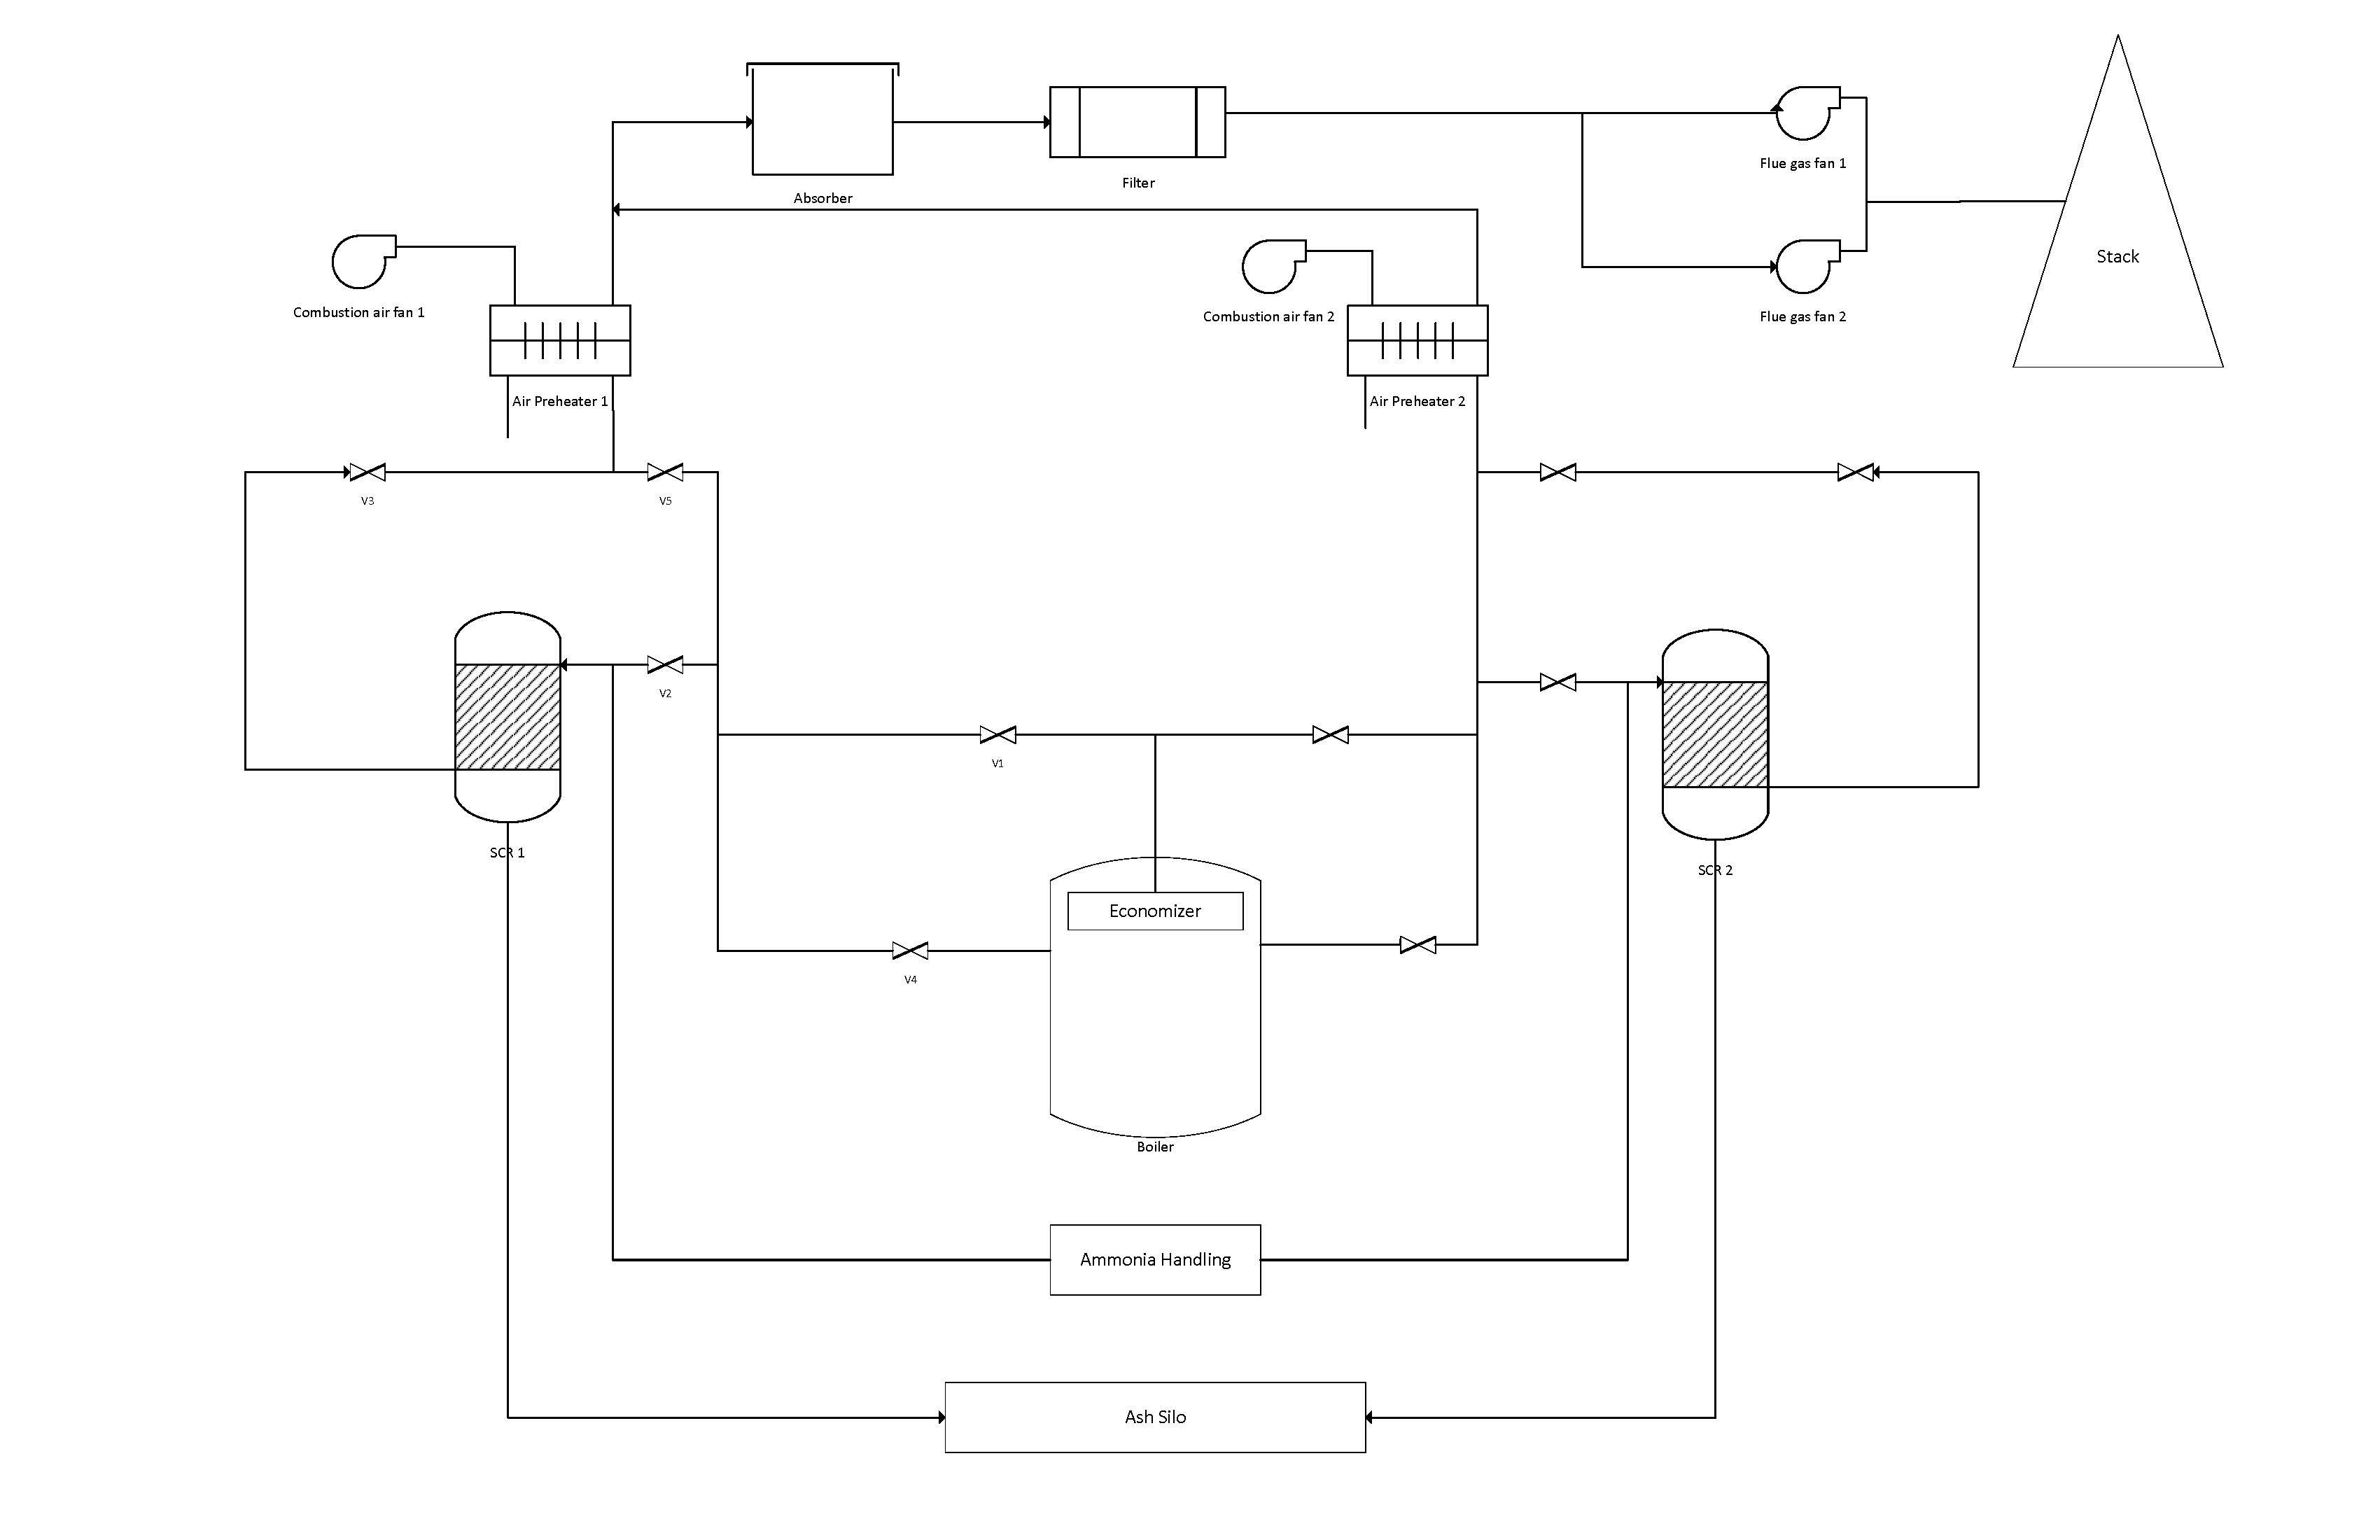
DeNOx Plant Overview
Operation of the DeNOx Plant
The DeNOx plant is highly automatic, controlled by Programmable Logic Control sequences. The sequences are S701-Purge, S702/703-Start/stop Reactors, S704/705-Heating of Reactors, S706/707-Ammonia Injection, S708/709-Product Handling and S710/711-Soot Blowing.
Over Fire Air
To reduce NOx, a quantity of additional air above all burner planes is supplied. This over-fire-air (OFA) reduces NOx by enabling richer fuel mix in the high-temperature combustion zone at the burners (two-step combustion). Approximately 10 % of the combustion air is added as OFA air. OFA controller failure (MD200 malfunction 0881) is modeled in the simulator:
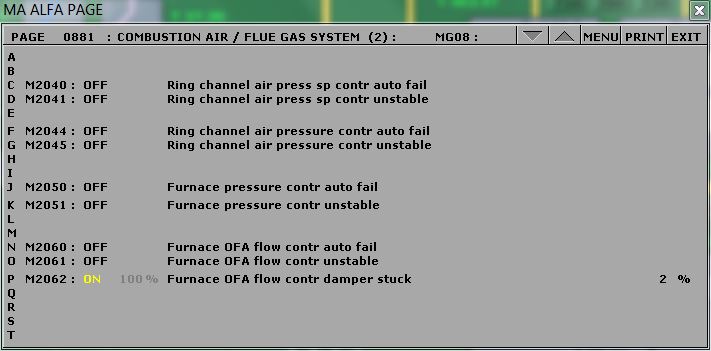
OFA controller failure.
Over Burner Air
To further reduce NOx generation, a portion of the secondary air is split off the main duct and directed into a third channel just above the burner. The damper controlling this over-burner-air is abbreviated OBA. OBA controller failure (MD180 malfunction 0780) is modeled in the simulator:
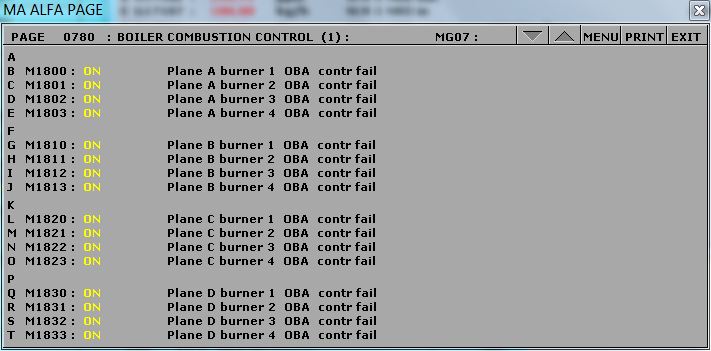
OBA controller failure.
Fuel Quality
In the simulator, the chemical composition of the coal or other fuels can be specified. The sum of the five components C, H, S, O and N should preferably add up to 100%, to avoid confusion, but it is not strictly necessary because the C, H, S, O and N setting is always recalculated to a 100% basis prior to using in other computations. Water and inert matter (ash/slag) should then be added. The water content varies much and has a great impact on the amount of preheating required by primary air. The simulator computes the lower heat value (including water/inert matter) and theoretical combustion air needed and flue gas produced. The air/flue gas values are given in ncm/kg (ncm=normal cubic meter).
In this lab, we will burn both default and lower quality coal for a comparison. Fuel data can be changed using Variable List page 0111 on MD180, for example:
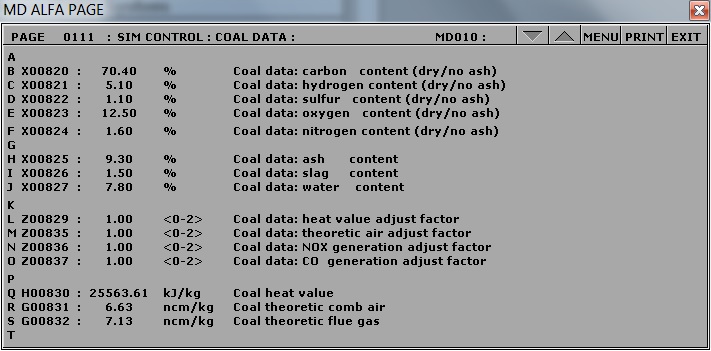
Chemical composition of coal
Lab Instructions
Run the initial condition I14 80% Coal and setup trends for the following variables:
G02197 X17821 G17107 X17106 D17104
T17103 C08444 G08444 G08443 C08400
- Stable operation: After 5 minutes of running a stable operation, freeze simulator and print the two trends. This is the reference point for the rest of the lab.
- OFA damper failure: Switch to run mode and activate malfunction 0881 on MD200. After 5 minutes, freeze simulator and print the two trends. Before moving on to the next step deactivate the malfunction.
- OBA control failure: Switch to run mode and activate malfunction 0780 on MD180. After 5 minutes, freeze simulator and print the two trends. Before moving on to the next step deactivate the malfunction.
- Burning poor qualityfuel: Switch to run mode and access Variable List page 0111 on MD180. Set the new values as shown below. After 5 minutes, freeze simulator and print the two trends.
- X00820: 70.40
- X00821: 5.10
- X00822: 1.10
- X00823: 12.50
- X00824: 1.60
- X00825: 9.30
- DeNOx plant bypassed: Switch to run mode and bypass the SCR 1 and SCR 2 on MD710 and MD720 respectively. After 5 minutes, freeze simulator and print the two trends.
Hints & Tips
Your trend windows should look like the following:
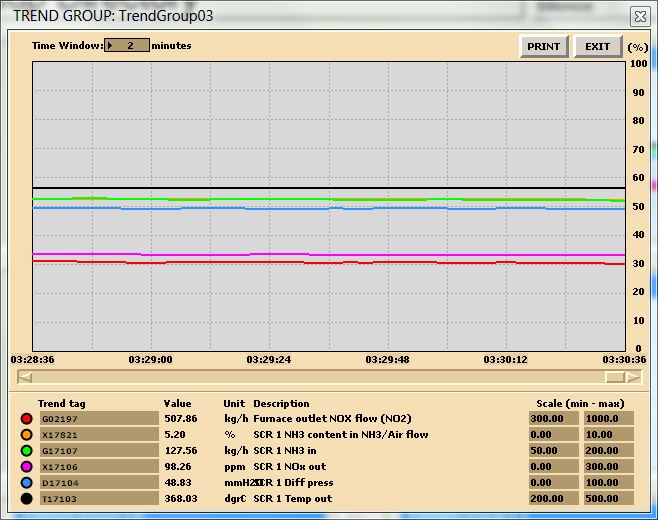
Trend sample 1: DeNOx plant data.
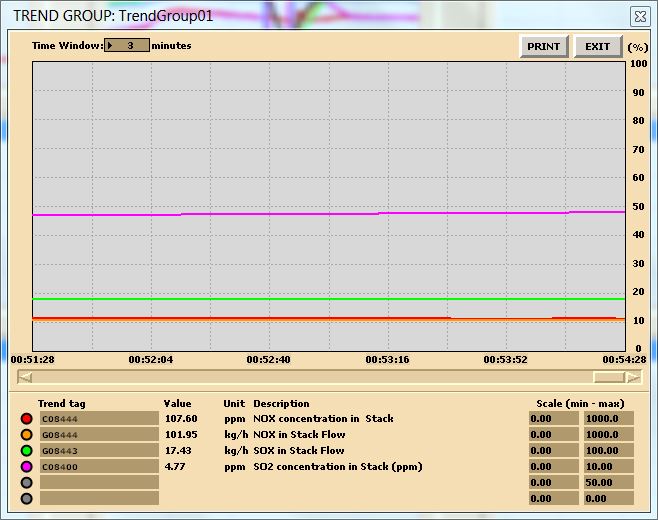
Trend sample 2: NOx stack data.
Make sure your trend printouts are labeled properly otherwise, data analysis will be very confusing.
Tabulate your data as shown below:
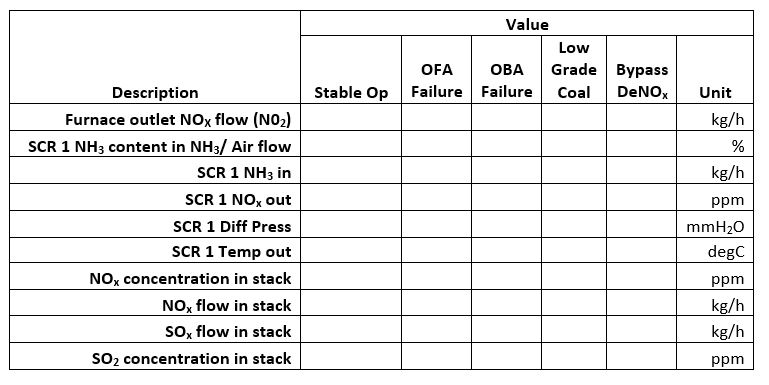
The deNOx plant data.
Percentage deviation can be expressed as

and tabulated as follows:
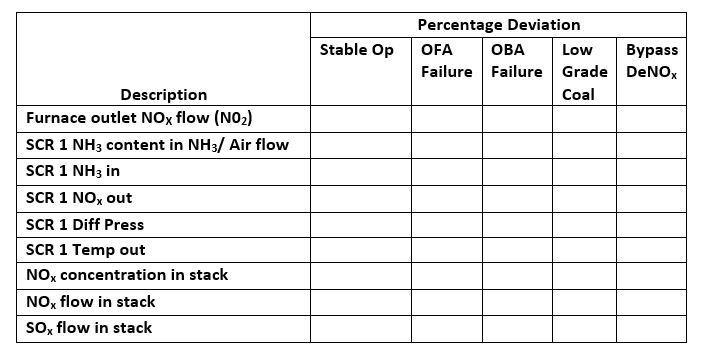
The deNOx plant deviation data.
Deliverables
Your lab report is to include the following:
- Trend plots: Supply all plots taken for this lab (make sure plots are labeled properly),
- Computation: Use MATLAB or MS Excel to process your data. Calculate the percentage deviation for each operation and plot your results,
- Conclusion: Write a summary (max. 500 words in a text box, if using Excel) comparing your results and suggestions for further study.
Further Reading:
- Thermal Power Plant Simulator Course Manual by BCIT: The DeNOx plant