
7.2: Examples
- Page ID
- 20047

\( \newcommand{\vecs}[1]{\overset { \scriptstyle \rightharpoonup} {\mathbf{#1}} } \)
\( \newcommand{\vecd}[1]{\overset{-\!-\!\rightharpoonup}{\vphantom{a}\smash {#1}}} \)
\( \newcommand{\id}{\mathrm{id}}\) \( \newcommand{\Span}{\mathrm{span}}\)
( \newcommand{\kernel}{\mathrm{null}\,}\) \( \newcommand{\range}{\mathrm{range}\,}\)
\( \newcommand{\RealPart}{\mathrm{Re}}\) \( \newcommand{\ImaginaryPart}{\mathrm{Im}}\)
\( \newcommand{\Argument}{\mathrm{Arg}}\) \( \newcommand{\norm}[1]{\| #1 \|}\)
\( \newcommand{\inner}[2]{\langle #1, #2 \rangle}\)
\( \newcommand{\Span}{\mathrm{span}}\)
\( \newcommand{\id}{\mathrm{id}}\)
\( \newcommand{\Span}{\mathrm{span}}\)
\( \newcommand{\kernel}{\mathrm{null}\,}\)
\( \newcommand{\range}{\mathrm{range}\,}\)
\( \newcommand{\RealPart}{\mathrm{Re}}\)
\( \newcommand{\ImaginaryPart}{\mathrm{Im}}\)
\( \newcommand{\Argument}{\mathrm{Arg}}\)
\( \newcommand{\norm}[1]{\| #1 \|}\)
\( \newcommand{\inner}[2]{\langle #1, #2 \rangle}\)
\( \newcommand{\Span}{\mathrm{span}}\) \( \newcommand{\AA}{\unicode[.8,0]{x212B}}\)
\( \newcommand{\vectorA}[1]{\vec{#1}} % arrow\)
\( \newcommand{\vectorAt}[1]{\vec{\text{#1}}} % arrow\)
\( \newcommand{\vectorB}[1]{\overset { \scriptstyle \rightharpoonup} {\mathbf{#1}} } \)
\( \newcommand{\vectorC}[1]{\textbf{#1}} \)
\( \newcommand{\vectorD}[1]{\overrightarrow{#1}} \)
\( \newcommand{\vectorDt}[1]{\overrightarrow{\text{#1}}} \)
\( \newcommand{\vectE}[1]{\overset{-\!-\!\rightharpoonup}{\vphantom{a}\smash{\mathbf {#1}}}} \)
\( \newcommand{\vecs}[1]{\overset { \scriptstyle \rightharpoonup} {\mathbf{#1}} } \)
\( \newcommand{\vecd}[1]{\overset{-\!-\!\rightharpoonup}{\vphantom{a}\smash {#1}}} \)
\(\newcommand{\avec}{\mathbf a}\) \(\newcommand{\bvec}{\mathbf b}\) \(\newcommand{\cvec}{\mathbf c}\) \(\newcommand{\dvec}{\mathbf d}\) \(\newcommand{\dtil}{\widetilde{\mathbf d}}\) \(\newcommand{\evec}{\mathbf e}\) \(\newcommand{\fvec}{\mathbf f}\) \(\newcommand{\nvec}{\mathbf n}\) \(\newcommand{\pvec}{\mathbf p}\) \(\newcommand{\qvec}{\mathbf q}\) \(\newcommand{\svec}{\mathbf s}\) \(\newcommand{\tvec}{\mathbf t}\) \(\newcommand{\uvec}{\mathbf u}\) \(\newcommand{\vvec}{\mathbf v}\) \(\newcommand{\wvec}{\mathbf w}\) \(\newcommand{\xvec}{\mathbf x}\) \(\newcommand{\yvec}{\mathbf y}\) \(\newcommand{\zvec}{\mathbf z}\) \(\newcommand{\rvec}{\mathbf r}\) \(\newcommand{\mvec}{\mathbf m}\) \(\newcommand{\zerovec}{\mathbf 0}\) \(\newcommand{\onevec}{\mathbf 1}\) \(\newcommand{\real}{\mathbb R}\) \(\newcommand{\twovec}[2]{\left[\begin{array}{r}#1 \\ #2 \end{array}\right]}\) \(\newcommand{\ctwovec}[2]{\left[\begin{array}{c}#1 \\ #2 \end{array}\right]}\) \(\newcommand{\threevec}[3]{\left[\begin{array}{r}#1 \\ #2 \\ #3 \end{array}\right]}\) \(\newcommand{\cthreevec}[3]{\left[\begin{array}{c}#1 \\ #2 \\ #3 \end{array}\right]}\) \(\newcommand{\fourvec}[4]{\left[\begin{array}{r}#1 \\ #2 \\ #3 \\ #4 \end{array}\right]}\) \(\newcommand{\cfourvec}[4]{\left[\begin{array}{c}#1 \\ #2 \\ #3 \\ #4 \end{array}\right]}\) \(\newcommand{\fivevec}[5]{\left[\begin{array}{r}#1 \\ #2 \\ #3 \\ #4 \\ #5 \\ \end{array}\right]}\) \(\newcommand{\cfivevec}[5]{\left[\begin{array}{c}#1 \\ #2 \\ #3 \\ #4 \\ #5 \\ \end{array}\right]}\) \(\newcommand{\mattwo}[4]{\left[\begin{array}{rr}#1 \amp #2 \\ #3 \amp #4 \\ \end{array}\right]}\) \(\newcommand{\laspan}[1]{\text{Span}\{#1\}}\) \(\newcommand{\bcal}{\cal B}\) \(\newcommand{\ccal}{\cal C}\) \(\newcommand{\scal}{\cal S}\) \(\newcommand{\wcal}{\cal W}\) \(\newcommand{\ecal}{\cal E}\) \(\newcommand{\coords}[2]{\left\{#1\right\}_{#2}}\) \(\newcommand{\gray}[1]{\color{gray}{#1}}\) \(\newcommand{\lgray}[1]{\color{lightgray}{#1}}\) \(\newcommand{\rank}{\operatorname{rank}}\) \(\newcommand{\row}{\text{Row}}\) \(\newcommand{\col}{\text{Col}}\) \(\renewcommand{\row}{\text{Row}}\) \(\newcommand{\nul}{\text{Nul}}\) \(\newcommand{\var}{\text{Var}}\) \(\newcommand{\corr}{\text{corr}}\) \(\newcommand{\len}[1]{\left|#1\right|}\) \(\newcommand{\bbar}{\overline{\bvec}}\) \(\newcommand{\bhat}{\widehat{\bvec}}\) \(\newcommand{\bperp}{\bvec^\perp}\) \(\newcommand{\xhat}{\widehat{\xvec}}\) \(\newcommand{\vhat}{\widehat{\vvec}}\) \(\newcommand{\uhat}{\widehat{\uvec}}\) \(\newcommand{\what}{\widehat{\wvec}}\) \(\newcommand{\Sighat}{\widehat{\Sigma}}\) \(\newcommand{\lt}{<}\) \(\newcommand{\gt}{>}\) \(\newcommand{\amp}{&}\) \(\definecolor{fillinmathshade}{gray}{0.9}\)Examples:
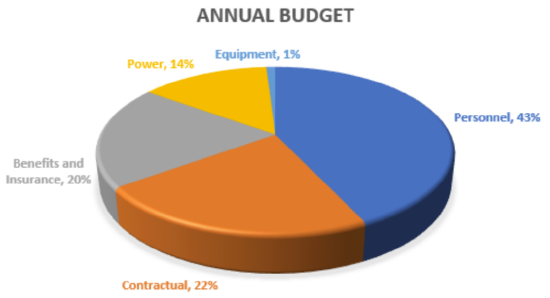
- A city’s sanitary sewer budget for the year is $350,000. The budget has been divided into five categories: Personnel, contractual, power, benefits and insurance, and equipment. Based on the pie chart, which category has the larger proportion of the budget been allocated to? Which category has the least allocation? Which two categories have similar allocations? What dollar amount has been allocated for power?
Solution
We can visually see that the largest part of the pie is allocated to personnel at 43% and the smallest part of the pie is allocated to equipment at 1%. The two pieces of the pie that are similar in size are for contractual and benefits and insurance which represent 22% and 20% respectively. It is also important to note that these percentages are based on the $350,000 budget. Hence the amount of money allocated for power is 14% of $350,000 or .14($35,000) = $4900.
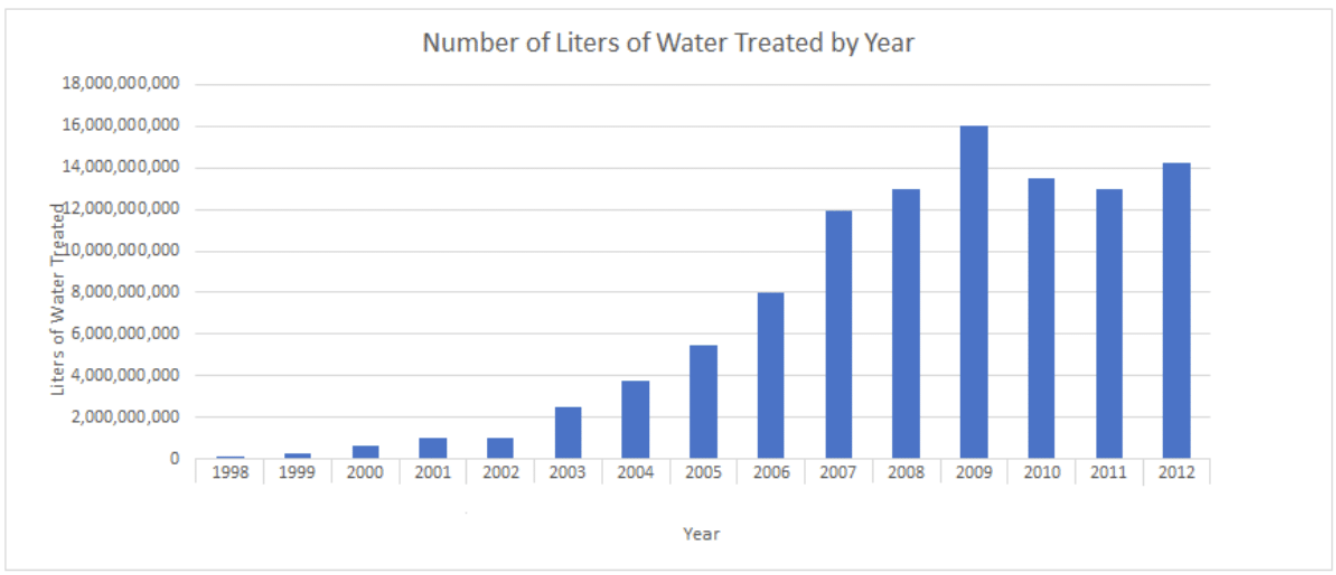
- Using the bar graph below, answer the following questions:
- What general information is provided in the bar graph?
- Which year had the most liters of treated water?
- Which year had the least liters of treated water?
- In which year was 8,000,000,000 liters of water treated?
- The amount of treated water increased between which years?
- The amount of treated water decreased between which years?
- Which years had approximately the same number of treated liters of water?
Solution
- What general information is provided in the bar graph? The number of liters of water treated each year between 1998 and 2012
- Which year had the most liters of treated water? 2009
- Which year had the least liters of treated water? 1998
- In which year was 8,000,000,000 liters of water treated? 2006
- The amount of treated water increased between which years? 1998-2009
- The amount of treated water decreased between which years? 2009-2011
- Which years had approximately the same number of treated liters of water? 2008 and 2011
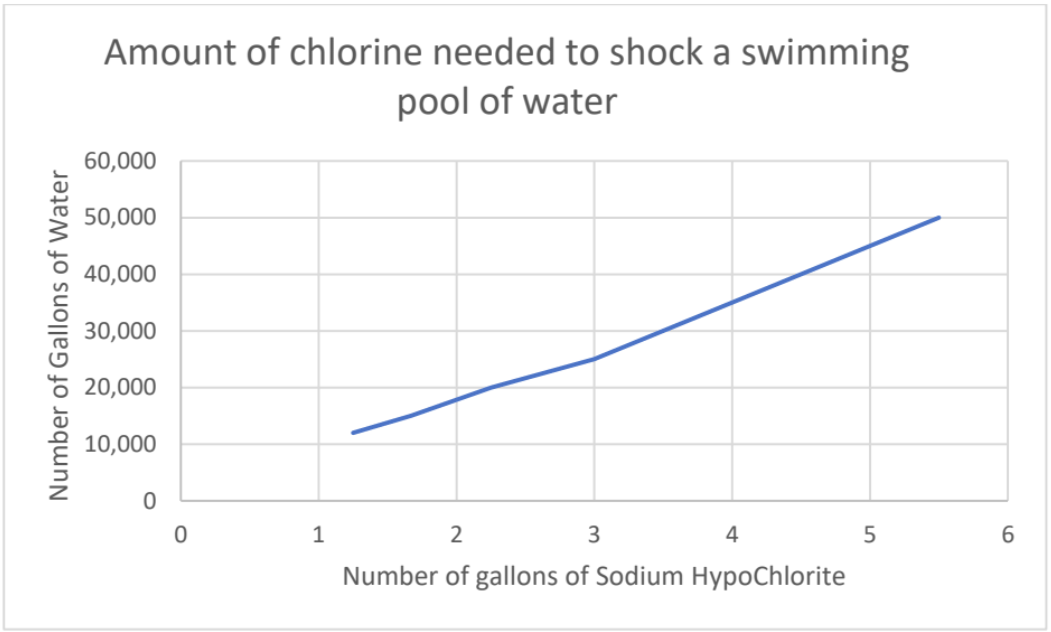
- Using the line graph below, answer the following questions:
- What general information is provided in the line graph?
- The number of gallons of water in the pool appear to increase, decrease, or remain the same as the number of gallons of Sodium HypoChlorite increases?
- How many gallons of Sodium HypoChlorite are needed to shock 25,000 gallons of water?
- How many gallons of water can 4 gallons of Sodium HypoChlorite shock?
- What is the maximum point on the graph and what does it represent?
Solution
- What general information is provided in the line graph? The number of gallons of Sodium HypoChlorite (a type of chlorine) that are needed to shock a certain number of gallons of water in a swimming pool.
- The number of gallons of water in the pool appear to increase, decrease, or remain the same as the number of gallons of Sodium HypoChlorite increases? Since the line graph is going up from left to right, the number of gallons of water in the pool is increasing as the number of gallons of Sodium HypoChlorite used increases.
- How many gallons of Sodium HypoChlorite are needed to shock 25,000 gallons of water? Reading the vertical axis, we can find 25,000 gallons of water, move to the right to find the point on the graph and read the corresponding number on the horizontal axis, which is 3 gallons of Sodium HypoChlorite.
- How many gallons of water can 4 gallons of Sodium HypoChlorite shock? Reading the horizontal axis, we can find 4 gallons of Sodium HypoChlorite, go up the graph to find the point on the graph and read the corresponding number on the vertical axis, which is 35,000 gallons of water.
- What is the maximum point on the graph and what does it represent? The highest point on the graph is at (5, 50000). Note: the horizontal number is written first in a point and the vertical axis number is written second. This point means we need 5 gallons of Sodium HypoChlorite to shock 50,000 gallons of swimming pool water.