
4.2: Segmentation - Where to Begin
- Page ID
- 22081

\( \newcommand{\vecs}[1]{\overset { \scriptstyle \rightharpoonup} {\mathbf{#1}} } \)
\( \newcommand{\vecd}[1]{\overset{-\!-\!\rightharpoonup}{\vphantom{a}\smash {#1}}} \)
\( \newcommand{\dsum}{\displaystyle\sum\limits} \)
\( \newcommand{\dint}{\displaystyle\int\limits} \)
\( \newcommand{\dlim}{\displaystyle\lim\limits} \)
\( \newcommand{\id}{\mathrm{id}}\) \( \newcommand{\Span}{\mathrm{span}}\)
( \newcommand{\kernel}{\mathrm{null}\,}\) \( \newcommand{\range}{\mathrm{range}\,}\)
\( \newcommand{\RealPart}{\mathrm{Re}}\) \( \newcommand{\ImaginaryPart}{\mathrm{Im}}\)
\( \newcommand{\Argument}{\mathrm{Arg}}\) \( \newcommand{\norm}[1]{\| #1 \|}\)
\( \newcommand{\inner}[2]{\langle #1, #2 \rangle}\)
\( \newcommand{\Span}{\mathrm{span}}\)
\( \newcommand{\id}{\mathrm{id}}\)
\( \newcommand{\Span}{\mathrm{span}}\)
\( \newcommand{\kernel}{\mathrm{null}\,}\)
\( \newcommand{\range}{\mathrm{range}\,}\)
\( \newcommand{\RealPart}{\mathrm{Re}}\)
\( \newcommand{\ImaginaryPart}{\mathrm{Im}}\)
\( \newcommand{\Argument}{\mathrm{Arg}}\)
\( \newcommand{\norm}[1]{\| #1 \|}\)
\( \newcommand{\inner}[2]{\langle #1, #2 \rangle}\)
\( \newcommand{\Span}{\mathrm{span}}\) \( \newcommand{\AA}{\unicode[.8,0]{x212B}}\)
\( \newcommand{\vectorA}[1]{\vec{#1}} % arrow\)
\( \newcommand{\vectorAt}[1]{\vec{\text{#1}}} % arrow\)
\( \newcommand{\vectorB}[1]{\overset { \scriptstyle \rightharpoonup} {\mathbf{#1}} } \)
\( \newcommand{\vectorC}[1]{\textbf{#1}} \)
\( \newcommand{\vectorD}[1]{\overrightarrow{#1}} \)
\( \newcommand{\vectorDt}[1]{\overrightarrow{\text{#1}}} \)
\( \newcommand{\vectE}[1]{\overset{-\!-\!\rightharpoonup}{\vphantom{a}\smash{\mathbf {#1}}}} \)
\( \newcommand{\vecs}[1]{\overset { \scriptstyle \rightharpoonup} {\mathbf{#1}} } \)
\(\newcommand{\longvect}{\overrightarrow}\)
\( \newcommand{\vecd}[1]{\overset{-\!-\!\rightharpoonup}{\vphantom{a}\smash {#1}}} \)
\(\newcommand{\avec}{\mathbf a}\) \(\newcommand{\bvec}{\mathbf b}\) \(\newcommand{\cvec}{\mathbf c}\) \(\newcommand{\dvec}{\mathbf d}\) \(\newcommand{\dtil}{\widetilde{\mathbf d}}\) \(\newcommand{\evec}{\mathbf e}\) \(\newcommand{\fvec}{\mathbf f}\) \(\newcommand{\nvec}{\mathbf n}\) \(\newcommand{\pvec}{\mathbf p}\) \(\newcommand{\qvec}{\mathbf q}\) \(\newcommand{\svec}{\mathbf s}\) \(\newcommand{\tvec}{\mathbf t}\) \(\newcommand{\uvec}{\mathbf u}\) \(\newcommand{\vvec}{\mathbf v}\) \(\newcommand{\wvec}{\mathbf w}\) \(\newcommand{\xvec}{\mathbf x}\) \(\newcommand{\yvec}{\mathbf y}\) \(\newcommand{\zvec}{\mathbf z}\) \(\newcommand{\rvec}{\mathbf r}\) \(\newcommand{\mvec}{\mathbf m}\) \(\newcommand{\zerovec}{\mathbf 0}\) \(\newcommand{\onevec}{\mathbf 1}\) \(\newcommand{\real}{\mathbb R}\) \(\newcommand{\twovec}[2]{\left[\begin{array}{r}#1 \\ #2 \end{array}\right]}\) \(\newcommand{\ctwovec}[2]{\left[\begin{array}{c}#1 \\ #2 \end{array}\right]}\) \(\newcommand{\threevec}[3]{\left[\begin{array}{r}#1 \\ #2 \\ #3 \end{array}\right]}\) \(\newcommand{\cthreevec}[3]{\left[\begin{array}{c}#1 \\ #2 \\ #3 \end{array}\right]}\) \(\newcommand{\fourvec}[4]{\left[\begin{array}{r}#1 \\ #2 \\ #3 \\ #4 \end{array}\right]}\) \(\newcommand{\cfourvec}[4]{\left[\begin{array}{c}#1 \\ #2 \\ #3 \\ #4 \end{array}\right]}\) \(\newcommand{\fivevec}[5]{\left[\begin{array}{r}#1 \\ #2 \\ #3 \\ #4 \\ #5 \\ \end{array}\right]}\) \(\newcommand{\cfivevec}[5]{\left[\begin{array}{c}#1 \\ #2 \\ #3 \\ #4 \\ #5 \\ \end{array}\right]}\) \(\newcommand{\mattwo}[4]{\left[\begin{array}{rr}#1 \amp #2 \\ #3 \amp #4 \\ \end{array}\right]}\) \(\newcommand{\laspan}[1]{\text{Span}\{#1\}}\) \(\newcommand{\bcal}{\cal B}\) \(\newcommand{\ccal}{\cal C}\) \(\newcommand{\scal}{\cal S}\) \(\newcommand{\wcal}{\cal W}\) \(\newcommand{\ecal}{\cal E}\) \(\newcommand{\coords}[2]{\left\{#1\right\}_{#2}}\) \(\newcommand{\gray}[1]{\color{gray}{#1}}\) \(\newcommand{\lgray}[1]{\color{lightgray}{#1}}\) \(\newcommand{\rank}{\operatorname{rank}}\) \(\newcommand{\row}{\text{Row}}\) \(\newcommand{\col}{\text{Col}}\) \(\renewcommand{\row}{\text{Row}}\) \(\newcommand{\nul}{\text{Nul}}\) \(\newcommand{\var}{\text{Var}}\) \(\newcommand{\corr}{\text{corr}}\) \(\newcommand{\len}[1]{\left|#1\right|}\) \(\newcommand{\bbar}{\overline{\bvec}}\) \(\newcommand{\bhat}{\widehat{\bvec}}\) \(\newcommand{\bperp}{\bvec^\perp}\) \(\newcommand{\xhat}{\widehat{\xvec}}\) \(\newcommand{\vhat}{\widehat{\vvec}}\) \(\newcommand{\uhat}{\widehat{\uvec}}\) \(\newcommand{\what}{\widehat{\wvec}}\) \(\newcommand{\Sighat}{\widehat{\Sigma}}\) \(\newcommand{\lt}{<}\) \(\newcommand{\gt}{>}\) \(\newcommand{\amp}{&}\) \(\definecolor{fillinmathshade}{gray}{0.9}\)Segmentation begins with the analysis of the city itself from a broad perspective. From that point, the information gathering process should steadily move inward. The marketplace, trading area, and consumer profiles should follow. Once the consumer profiles are established, the competition comes under scrutiny and grouping - who else wants to attract the segments you might choose?
Thus, after researching the entire marketplace and customer base, it is now time to identify groupings of customers with similar attributes that influence their purchasing patterns within the total population. The goal of dividing the trading area into segments is to create a market strategy for your food service operation that (1) identifies targeted groups, (2) divided the industry into identifiable business segments, and (3) allows you to estimate the total local demand for the business segments chosen as viable consumers for your concept.
Identifying Market Segments - the Process
Begin with the identification of the market segments you organization will appeal. Decisions should embrace a rationale for reasoning through 'why' this will occur and these segments are appropriate. To address the appropriate segmentation questions the following sub-questions should considered prior to selection and rationale. The following what, where, when, and how questions will help guide your information gathering and keep the process on target.
What?
- What do our customers need, want, and desire?
- What primary products and services do our customers buy?
- What is the annual worth of our average customer?
- What products do we off, or intend to offer?
- What trends are occurring with could potentially have an impact consumer buying?
- What new products could we develop to capitalize on trends and potential consumer interests?
- What products could we use, or develop, to add more value from the perspective of the consumer?
Where?
- Where do we sell, or intend to sell, our products and services in demand?
- Where do customers prefer to make their purchases (dining room, take out delivery, etc.)?
- Where should we sell our products and services to attract our desired consumers?
When?
- When are our products and services in demand (how often)?
- When do our customers and potential customers buy (day part, week, or year)?
How?
- How far in advance will consumers purchase our products and services?
- How would consumers prefer to contact us (directly, online, etc.)?
- How can we bundle together good and services to increase the customer's desire to purchase?
- How can we customize our products and services to reach various niche markets available in the trading area?
- How else should we consider thing about these potential consumers?
- How do, or will, consumers perceive the price value of our offerings?
- How could we change our price/value positioning if it were necessary to do so?
While this list of questions is by no means exhaustive, it provides a wonderful place to begin and at this point in the process, selection decisions and rationale (reasons for choosing them) formulation should be underway. The rationale is vital to the process because the reasons for selecting consumer segments and their associated behavior patterns will play an important part in the marketing scheme developed to attract them, and products and services offered to keep them. Now come the more appropriate grouping questions.
- Why do these consumers have similar buying patterns?
- What data supports this?
- Why is this demographic or psychographic attribute a good way to use to segment the population of the trading area (income, education, lifestyle, and so forth)?
- Why do our current customers purchase our products and services?
- Why do our potential customers purchase products and services from competitors?
As the data undergoes analysis and consideration, the need for and use of perceptual maps deserves consideration. These maps are probably the most appropriate method to convey the opportunities and threats an operation would face should they enter the market place.
See the following box plot. Visual representation makes things clear for everyone.
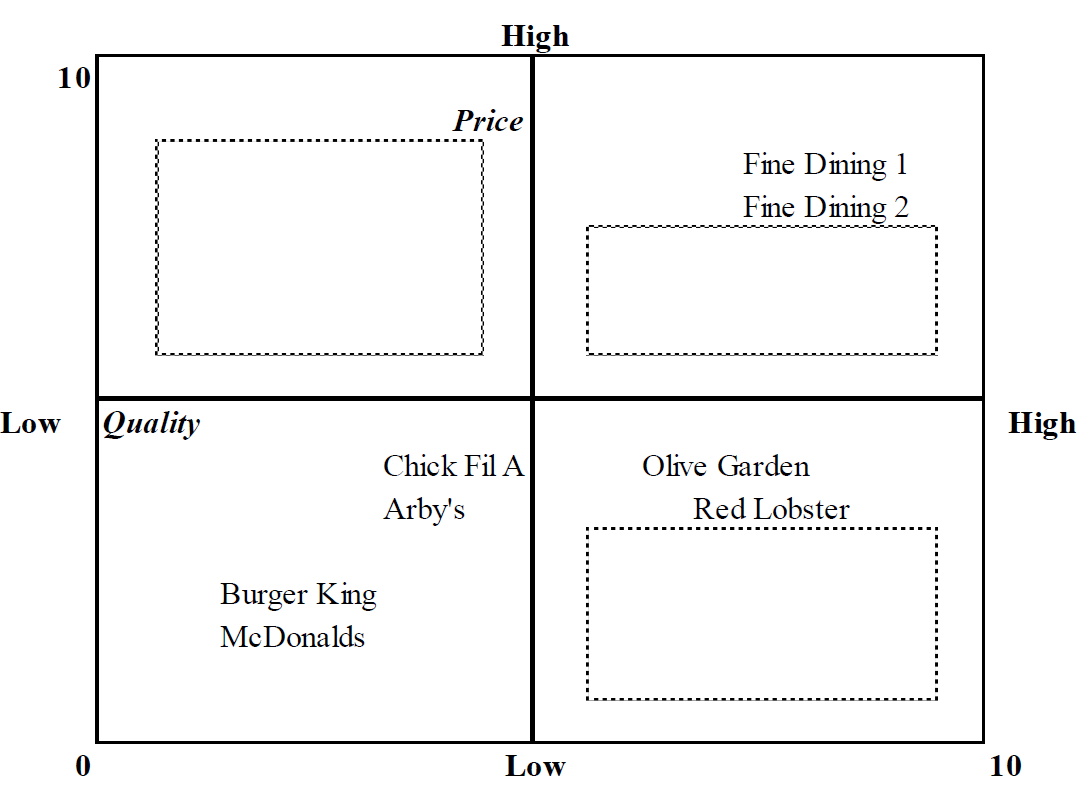
As part of the segment identification process, discuss the industry business segment from a competitive point of view. Divide the foodservice industry into competitive groups using themes such as similar attributes, pricing, type of service, and so forth. It is also important to describe the foodservice industry from another perspective - that of the consumer. Clearly state the information on which your arguments turn. In sum, you are reducing the market down to segments, competitors, and consumers based on gathered information, the nature of the competition, and how consumers perceive the environment.
Segmentation Strategy
What grouping strategy would be the most appropriate and effective as far as targeting groups in the trading area? How you group consumers ultimately determines how you would devise the organization's marketing program and the types of advertisement and promotion that would lend itself to attracting the right consumers to your operation. Who is you primary target audience - the consumers who are the best fit for your products and services. Who are your secondary, or indirect, target audience - those who might use your services less frequently, or be attracted to you over time?
Segment Demand
What is the total segment demand for the marketplace? Although this is a dollars and cents question, the purpose of arriving at the total demand for the marketplace is to determine whether, or not, the market can adequately support additional foodservice operations. This is the first step in calculating the adequacy of the segments you elect to target in the trading area. For example, if you chose to target individuals in the age range of 18 to 25 years, is there a sufficient number of these consumers to support your concept? If not you would have to expand your consumer base to include say 26 to 35 years of age ;or beyond if you are interested in locating in a smaller community. You might have to approach consumers up to the age of 65 to have a large enough base to insure enough potential customers on any given day. The importance of knowing whom you must attract affects, the physical facility, the menu you serve, the pricing you use, and the variety of marketing needed to reach and appeal to the larger range of consumer interests of the broader range of consumers you would need to be successful.
Once you have computed the total foodservice dollars spend in the marketplace, you then quantify the total amount of potential sales ($$$) for foodservice products in your chosen business segment in your trading area. This type of information is typically obtainable from the city Chamber of Commerce, city sales tax records, commercial real estate agencies, and demographic information related to city revenue. Other methods would include the following: (1) In some cases, foodservice organizations will assign a revenue estimate to the population count, say 50 cents to $1.00 or more to each resident in the trading area and projects a potential revenue figure. (2) A new operation could calculate the population percentage of the selected target segment age groups in relation to the total population of the marketplace and assume that percentage of the total foodservice revenue as a place to develop the potential revenue available to a restaurant operation. (3) An organization could also assume a percentage of the revenue that your competition would garner from the trading area as well and back this figure down to the reasonable amount you might obtain. (4) An established organization could project, based on their previous sales history, what a new operation in a different location might obtain based on a proven concept and how other trading areas and competitive elements have received and supported the concept.
The method(s) used to determine the ‘segment demand dollar calculation’ is at the discretion of the organization. It is important to develop a rationale explaining 'why' the method(s) used become the ‘choice’ to make the calculation. This has two purposes. First, it forces the organization to look critically at the viability of moving forward with their concept. Second, it provides documentation regarding the ‘choice’ to lenders who are scrutinizing the prudence of financing the venture. The more careful the process, the more credibility the results will appear when the presentation occurs. Thus, although other methods were available, these methods form our selection based on the following reasons.... It lets lenders know that your organization was aware of various methods to determine the needed information and a careful selection process ensued to use accurate and appropriate methods of selection to produce the best information possible.
Once all of the calculations are complete, the organization should be able to make a determination regarding what share of the targeted segment(s) your operation will attract based on the number of competitors in the general trading area and the total demand in the restaurant segment. Other questions of importance can receive assessment based on the number of seats provided to consumers by the competitions as well as the seating potential of your operation.
Method of delivery
A major consideration that may surface from examining the restaurant segment or the physical location would concern how customers will receive your products or services. Will seating in the dining room be the sole method of delivery used? Will other delivery methods be considerations for reaching customers? For example, a dining room can be significantly extendable by promoting drive-through business, carry out business, or a delivery service. The organization should select delivery methods that would significantly enhance their chances to receive an average or greater market share. Areas of the operation such as these are important issues to consider initially because they would affect the physical layout of the operation for proper implementation. The movement of people is an important consideration regarding a restaurant's layout. For instance, the ease for customers to place and pick up a carry out order. Although this sounds simple, proper location and connection to the restaurant's kitchen are important issues that require thoughtful consideration.
Identifying the market for segmentation
The market for a given product or service known as the market potential or the ‘total addressable market’ (TAM). The market analyst should begin by identifying the size of the potential market. For existing products and services, estimating the size and value of the market potential is relatively ‘straightforward’. However, estimating the market potential can be very challenging when a product or service is ‘totally’ new to the market and no historical data on which to base forecasts exists.
A basic approach is to first assess the size of the broad population, then estimate the percentage likely to use the product or service and finally to estimate the revenue potential. For example, when the ride-sharing company, Uber, first entered the market, the owners assumed that Uber would be a substitute for taxis and hire cars. Accordingly, they calculated Uber's TAM based on the size of the existing taxi and car service business, which they estimated at $100 billion. They then made a conservative estimate that the company could reach 10 percent share of market and used this to estimate the expected revenue. To estimate market size, a marketer might evaluate adoption and growth rates of comparable technologies.
Another approach is to use historical analogy. For example, the manufacturer of HDTV might assume that the number of consumers willing to adopt high definition TV will be similar to the adoption rate for Color TV. To support this type of analysis, data for household penetration of TV, Radio, PCs and other communications technologies is readily available from government statistics departments. Finding useful analogies can be challenging because every market is unique. However, analogous product adoption and growth rates can provide the analyst with benchmark estimates used to cross validate other methods that might be useful to forecast sales or market size. A more robust technique for estimating the market potential is the Bass diffusion model, which is the equation that follows:
N(t) – N(t−1) = [p + qN(t−1)/m] x [m – N(t−1)]
Where:
N(t)= the number of adopters in the current time period, (t)
N(t−1)= the number of adopters in the previous time period, (t-1)
p = the coefficient of innovation
q = the coefficient of imitation (the social contagion influence)
m = an estimate of the number of eventual adopters
The major challenge with the Bass model is estimating the parameters for p and q. However, the Bass model has been so widely used in empirical studies that the values of p and q for more than 50 consumer and industrial categories have been determined and are widely published in tables. The average value for p is 0.037 and for q is 0.327.
Major bases used for segmenting a market
A major step in the segmentation process is the selection of a suitable base. In this step, marketers are looking for a means of achieving internal homogeneity (similarity within the segments), and external heterogeneity (differences between segments). In other words, they are searching for a process that minimize differences between members of a segment and maximize differences between each segment. In addition, the segmentation approach must yield segments that are meaningful for the specific marketing problem or situation. For example, a person's ‘hair color’ may be a relevant base for a shampoo manufacturer, but it would not be relevant for a seller of food services. Selecting the right base requires a good deal of thought and a basic understanding of the market under scrutiny.
In reality, marketers can segment the market using any base or variable as long as it is identifiable, measurable, actionable, and stable. For example, some fashion houses have segmented the market using women's dress size as a variable. However, the most common bases for segmenting consumer markets include geographic, demographic, psychographic tendencies and behavior. Marketers normally select a single base for the segmentation analysis, although, some bases can be combined into a single segmentation with care. For example, one can combine geographic and demographic data, but other bases are rarely suitable for combination. Given that psychographics includes demographic variables such as age, gender and income as well as attitudinal and behavioral variables, it makes little logical sense to combine psychographics with demographics or other bases. Any attempt to use combined bases needs careful consideration and a logical foundation.
Demographic segmentation
Segmentation according to demography centers on consumer- demographic variables such as age, income, family size, socio-economic status, etc. Demographic segmentation assumes that consumers with similar demographic profiles will exhibit similar purchasing patterns, motivations, interests and lifestyles and that these characteristics will translate into similar product/brand preferences. In practice, demographic segmentation can potentially employ any variable used by the nation's census collectors.
Typical demographic variables and their descriptors are as follows:
- Age: e.g. Under 5, 5–8 years, 9–12 years, 13–17 years, 18–24, 25–29, 30–39, 40–49, 50–59, 60+
- Gender: Male, Female
- Occupation: Professional, self-employed, semi-professional, clerical/ admin, sales, trades, mining, primary producer, student, home duties, unemployed, retired
- Social class (or socio-economic status): A, B, C, D, E, or I, II, III, IV or V (normally divided into quintiles)
- Marital Status: Single, married, divorced, widowed
- Family Life-stage: Young single; Young married with no children; Young family with children under 5 years; Older married with children; Older married with no children living at home, Older living alone
- Family size/ dependents: 0, 1–2, 3–4, 5+
- Income: Under $10,000; 10,000–20,000; 20,001–30,000; 30,001–40,000, 40,001–50,000 etc.
- Educational attainment: Primary school; Some secondary, Completed secondary, Some university, Degree; Post graduate or higher degree
- Home ownership: Renting, Own home with mortgage, Home owned outright
- Ethnicity: Asian, African, Aboriginal, Polynesian, Melanesian, Latin-American, African-American, American Indian etc.
- Religion: Catholic, Protestant, Muslim, Jewish, Buddhist, Hindu, Other
| Segmentation base | Brief explanation of base (and example) | Typical segments |
|---|---|---|
| Demographic | Quantifiable population characteristics. (Age, gender, income, education, socio-economic status, family size or situation). | Young, Upwardly-mobile, Prosperous, Professionals (YUPPY); Double Income No Kids (DINKS); Greying, Leisured And Moneyed (GLAMS); Empty- nester, Full-nester |
| Geographic (geo-clusters) | Combination of geographic & demographic variables. | Rural farmers, Urban professionals, |
| Psychographics | Lifestyle, social or personality characteristics. (typically includes basic demographic descriptors) | Socially Aware; Traditionalists, Conservatives, Active 'club-going' young professionals |
| Behavioral | Purchasing, consumption or usage behavior. (Needs-based, benefit-sought, usage occasion, purchase frequency, customer loyalty, buyer readiness). | Tech-savvy ; Heavy users, Enthusiasts; Early adopters, Opinion Leaders, Luxury-seekers, Price-conscious, Quality-conscious, Time-poor |
Geographic segmentation
This form of segmentation divides markets according to geographic criteria. In practice, markets can be segmented as broadly as continents and as narrowly as neighborhoods or postal codes. Typical geographic variables include:
- Country: USA, UK, China, Japan, South Korea, Malaysia, Singapore, Australia, New Zealand.
- Region: North, North-west, Mid-west, South, Central.
- Population density: central business district (CBD), urban, suburban, rural, regional.
- City or town size: under 1,000; 1,000–5,000; 5,000–10,000 ... 1,000,000–3,000,000 and over 3,000,000.
- Climatic zone: Mediterranean, Temperate, Sub-Tropical, Tropical, Polar.
The geo-cluster approach combines demographic data with geographic data to create richer, more detailed profiles. Geo-cluster approaches are a consumer classification system designed market segmentation and consumer profiling purposes. They classify residential regions or postcodes on the basis of census and lifestyle characteristics obtained from a wide range of sources. This allows the segmentation of a population into smaller groups defined by individual characteristics such as demographic, socio-economic or other shared socio-demographic characteristics.
Consider Geographic segmentation to be the first step in international marketing, where marketers must decide whether to adapt their existing products and marketing programs for the unique needs of distinct geographic markets. Tourism Marketing Boards often segment international visitors based on their country of origin. By way of example, “Tourism Australia” undertakes marketing in 16 core geographic markets; of which China, UK, US, New Zealand and Japan are priority segments because they have the greatest potential for growth and are extremely profitable segments with higher than average expenditure per visit. Tourism Australia carries out extensive research on each of these segments and develops rich profiles of high priority segments to understand their needs and how travel decisions are determined. Insights from this analysis drive travel product development, allocation of promotional budgets, advertising strategy and in broader urban planning decisions. For example, in light of the numbers of Japanese visitors, the city of Melbourne has erected Japanese signage in tourist precincts.
Behavioral segmentation
Behavioral segmentation divides consumers into groups according to their observed behaviors. Many marketers believe that behavioral variables are superior to demographic and geographic data for building market segments. Typical behavioral variables and their descriptors include:
- Purchase/Usage Occasion: regular occasion, special occasion, celebration, and gift giving
- Benefit-Sought: economy, quality, service level, convenience, access
- User Status: First-time user, Regular user, Non-user
- Usage Rate/ Purchase Frequency: Light user, heavy user, moderate user
- Loyalty Status: Loyal, switcher, non-loyal, lapsed
- Buyer Readiness: Unaware, aware, intention to buy
- Attitude to Product or Service: Enthusiast, Indifferent, Hostile; Price Conscious, Quality Conscious
- Adopter Status: Early adopter, late adopter, laggard
Note that these descriptors are merely commonly used examples. Marketers customize the variable and descriptors for both local conditions and for specific applications. For example, in the health industry, planners often segment broad markets according to 'health consciousness' and identify low, moderate and highly health conscious segments. This is an applied example of behavioral segmentation, using attitude to product or service as a key descriptor or the variable customized for the specific application.
Purchase/usage occasion
Purchase or usage occasion segmentation focuses on analyzing occasions when consumers might purchase or consume a product. This approach customer-level and occasion-level segmentation models and provides an understanding of the individual customers’ needs, behavior and value under different occasions of usage and time. Unlike traditional segmentation models, this approach assigns more than one segment to each unique customer, depending on the current circumstances.
- Immediate Eat (34%): Driven by the need to snack, indulge or an energy boost.
- Home Stock (25%): Driven by the need to have something in the pantry to share with family in front of TV or for home snacking.
- Kids (17%): Driven by need for after school snacks, parties, treats.
- Gift-giving (15%): Products purchased as gifts, needs include a token of appreciation, a romantic gesture or a special occasion.
- Seasonal (3.4%): Driven by need to give a present or create a festive atmosphere. The products are relevant on feast days such as Christmas, Easter.
Benefit Sought
Benefit sought (referred to needs-based segmentation) divides markets into distinct needs, perceived value, benefits sought or advantage that accrues from the purchase of a product or service. Marketers using benefit-sought segmentation might develop products with different quality levels, performance, customer service, special features or any other meaningful benefit and pitch different products at each of the segments identified. Benefit segmentation is one of the more commonly used approaches to segmentation and is widely used in many consumer markets including motor vehicles, fashion and clothing, furniture, consumer electronics and holiday-makers.
Other types of Consumer Segmentation
In addition to geographic, demographic, psychographic, and behavioral bases, marketers occasionally turn to other means to segment a market, or, to develop segment profiles.
Generational segments
A generation is definable as "a cohort of people born within a similar span of time (15 years at the upper end) who share a comparable ‘age’ and ‘life stage’ and who were shaped by a particular span of time (events, trends and developments)." Generational segmentation refers to the process of dividing and analyzing a population into cohorts based on their birth date. Generational segmentation assumes the shape of people's values and attitudes by the key events that occurred during their lives and that these attitudes translate into product and brand preferences.
Demographers, studying population change, disagree about precise dates for each generation. Dating is normally achievable by identifying population peaks or troughs, which can occur at different times in each country. For example, in Australia the post-war population boom peaked in 1960, while the peak occurred somewhat later in the USA and Europe, with most estimates converging on 1964. Accordingly, by definition Australian Boomers are those born between 1945 and 1960 - while American and European Boomers depict those born in 1945 to 1964. Thus, the generational segments and their dates discussed here are approximations only.
The primary generational segments identified by marketers are:
- Builders: born 1920 to 1945
- Baby Boomers: born about 1945–1965
- Generation X: born about 1966–1976
- Generation Y: also known as ‘Millennials’; born about 1977–1994
- Generation Z: also known as Centennials; born 1995–2015
Unique characteristics of selected generations
| Millennials | Generation X | Baby Boomers |
|---|---|---|
| Technology use (24%) | Technology use (12%) | Work ethic (17%) |
| Music/ popular culture (11%) | Work ethic (11%) | Respectful (14%) |
| Liberal/ tolerant (7%) | Conservative/ traditional (7%) | Values/ morals (8%) |
| Smarter (6%) | Smarter (6%) | Smarter (5%) |
| Clothes (5%) | Respectful (5%) | Not applicable |
Cultural segmentation
Cultural segmentation is useful to classify markets according to cultural origin. Culture is a major dimension of consumer behavior and can be used to enhance customer insight and as a component of predictive models. Cultural segmentation enables the use of appropriately constructed communications for particular cultural communities. Cultural segmentation is applicable to existing customer data to measure market penetration in key cultural segments by product, brand, channel as well as traditional measures of recently, frequency and monetary value. These benchmarks form an important evidence-base to guide strategic direction and tactical campaign activity, allowing the restaurateur to monitor engagement trends over time.
One can map Cultural segmentation according to state, region, suburb and neighborhood. This provides a geographical market view of population proportions and may be of benefit in selecting appropriately located premises, determining territory boundaries and local marketing activities. Census data is a valuable source of cultural data but not meaningfully applicable to individuals. Name analysis is the most reliable and efficient means of describing the cultural origin of individuals. The accuracy of using name analysis as a surrogate for cultural background in Australia is 80–85%, after allowing for female name changes due to marriage, social or political reasons or colonial influence. The extent of name data coverage means a user will code a minimum of 99 percent of individuals with their most likely ancestral origin.