
7.1: Introduction
- Page ID
- 44428
\( \newcommand{\vecs}[1]{\overset { \scriptstyle \rightharpoonup} {\mathbf{#1}} } \)
\( \newcommand{\vecd}[1]{\overset{-\!-\!\rightharpoonup}{\vphantom{a}\smash {#1}}} \)
\( \newcommand{\dsum}{\displaystyle\sum\limits} \)
\( \newcommand{\dint}{\displaystyle\int\limits} \)
\( \newcommand{\dlim}{\displaystyle\lim\limits} \)
\( \newcommand{\id}{\mathrm{id}}\) \( \newcommand{\Span}{\mathrm{span}}\)
( \newcommand{\kernel}{\mathrm{null}\,}\) \( \newcommand{\range}{\mathrm{range}\,}\)
\( \newcommand{\RealPart}{\mathrm{Re}}\) \( \newcommand{\ImaginaryPart}{\mathrm{Im}}\)
\( \newcommand{\Argument}{\mathrm{Arg}}\) \( \newcommand{\norm}[1]{\| #1 \|}\)
\( \newcommand{\inner}[2]{\langle #1, #2 \rangle}\)
\( \newcommand{\Span}{\mathrm{span}}\)
\( \newcommand{\id}{\mathrm{id}}\)
\( \newcommand{\Span}{\mathrm{span}}\)
\( \newcommand{\kernel}{\mathrm{null}\,}\)
\( \newcommand{\range}{\mathrm{range}\,}\)
\( \newcommand{\RealPart}{\mathrm{Re}}\)
\( \newcommand{\ImaginaryPart}{\mathrm{Im}}\)
\( \newcommand{\Argument}{\mathrm{Arg}}\)
\( \newcommand{\norm}[1]{\| #1 \|}\)
\( \newcommand{\inner}[2]{\langle #1, #2 \rangle}\)
\( \newcommand{\Span}{\mathrm{span}}\) \( \newcommand{\AA}{\unicode[.8,0]{x212B}}\)
\( \newcommand{\vectorA}[1]{\vec{#1}} % arrow\)
\( \newcommand{\vectorAt}[1]{\vec{\text{#1}}} % arrow\)
\( \newcommand{\vectorB}[1]{\overset { \scriptstyle \rightharpoonup} {\mathbf{#1}} } \)
\( \newcommand{\vectorC}[1]{\textbf{#1}} \)
\( \newcommand{\vectorD}[1]{\overrightarrow{#1}} \)
\( \newcommand{\vectorDt}[1]{\overrightarrow{\text{#1}}} \)
\( \newcommand{\vectE}[1]{\overset{-\!-\!\rightharpoonup}{\vphantom{a}\smash{\mathbf {#1}}}} \)
\( \newcommand{\vecs}[1]{\overset { \scriptstyle \rightharpoonup} {\mathbf{#1}} } \)
\(\newcommand{\longvect}{\overrightarrow}\)
\( \newcommand{\vecd}[1]{\overset{-\!-\!\rightharpoonup}{\vphantom{a}\smash {#1}}} \)
\(\newcommand{\avec}{\mathbf a}\) \(\newcommand{\bvec}{\mathbf b}\) \(\newcommand{\cvec}{\mathbf c}\) \(\newcommand{\dvec}{\mathbf d}\) \(\newcommand{\dtil}{\widetilde{\mathbf d}}\) \(\newcommand{\evec}{\mathbf e}\) \(\newcommand{\fvec}{\mathbf f}\) \(\newcommand{\nvec}{\mathbf n}\) \(\newcommand{\pvec}{\mathbf p}\) \(\newcommand{\qvec}{\mathbf q}\) \(\newcommand{\svec}{\mathbf s}\) \(\newcommand{\tvec}{\mathbf t}\) \(\newcommand{\uvec}{\mathbf u}\) \(\newcommand{\vvec}{\mathbf v}\) \(\newcommand{\wvec}{\mathbf w}\) \(\newcommand{\xvec}{\mathbf x}\) \(\newcommand{\yvec}{\mathbf y}\) \(\newcommand{\zvec}{\mathbf z}\) \(\newcommand{\rvec}{\mathbf r}\) \(\newcommand{\mvec}{\mathbf m}\) \(\newcommand{\zerovec}{\mathbf 0}\) \(\newcommand{\onevec}{\mathbf 1}\) \(\newcommand{\real}{\mathbb R}\) \(\newcommand{\twovec}[2]{\left[\begin{array}{r}#1 \\ #2 \end{array}\right]}\) \(\newcommand{\ctwovec}[2]{\left[\begin{array}{c}#1 \\ #2 \end{array}\right]}\) \(\newcommand{\threevec}[3]{\left[\begin{array}{r}#1 \\ #2 \\ #3 \end{array}\right]}\) \(\newcommand{\cthreevec}[3]{\left[\begin{array}{c}#1 \\ #2 \\ #3 \end{array}\right]}\) \(\newcommand{\fourvec}[4]{\left[\begin{array}{r}#1 \\ #2 \\ #3 \\ #4 \end{array}\right]}\) \(\newcommand{\cfourvec}[4]{\left[\begin{array}{c}#1 \\ #2 \\ #3 \\ #4 \end{array}\right]}\) \(\newcommand{\fivevec}[5]{\left[\begin{array}{r}#1 \\ #2 \\ #3 \\ #4 \\ #5 \\ \end{array}\right]}\) \(\newcommand{\cfivevec}[5]{\left[\begin{array}{c}#1 \\ #2 \\ #3 \\ #4 \\ #5 \\ \end{array}\right]}\) \(\newcommand{\mattwo}[4]{\left[\begin{array}{rr}#1 \amp #2 \\ #3 \amp #4 \\ \end{array}\right]}\) \(\newcommand{\laspan}[1]{\text{Span}\{#1\}}\) \(\newcommand{\bcal}{\cal B}\) \(\newcommand{\ccal}{\cal C}\) \(\newcommand{\scal}{\cal S}\) \(\newcommand{\wcal}{\cal W}\) \(\newcommand{\ecal}{\cal E}\) \(\newcommand{\coords}[2]{\left\{#1\right\}_{#2}}\) \(\newcommand{\gray}[1]{\color{gray}{#1}}\) \(\newcommand{\lgray}[1]{\color{lightgray}{#1}}\) \(\newcommand{\rank}{\operatorname{rank}}\) \(\newcommand{\row}{\text{Row}}\) \(\newcommand{\col}{\text{Col}}\) \(\renewcommand{\row}{\text{Row}}\) \(\newcommand{\nul}{\text{Nul}}\) \(\newcommand{\var}{\text{Var}}\) \(\newcommand{\corr}{\text{corr}}\) \(\newcommand{\len}[1]{\left|#1\right|}\) \(\newcommand{\bbar}{\overline{\bvec}}\) \(\newcommand{\bhat}{\widehat{\bvec}}\) \(\newcommand{\bperp}{\bvec^\perp}\) \(\newcommand{\xhat}{\widehat{\xvec}}\) \(\newcommand{\vhat}{\widehat{\vvec}}\) \(\newcommand{\uhat}{\widehat{\uvec}}\) \(\newcommand{\what}{\widehat{\wvec}}\) \(\newcommand{\Sighat}{\widehat{\Sigma}}\) \(\newcommand{\lt}{<}\) \(\newcommand{\gt}{>}\) \(\newcommand{\amp}{&}\) \(\definecolor{fillinmathshade}{gray}{0.9}\)Salinity is frequently a threat to irrigated agriculture. Have you ever wondered, What is the impact of salinity on crop production or the environment? How and where would you measure salinity? There are various types of salinity problems which can affect crops and soil in different ways. How can a producer best cope with the threats of excess salts? These questions are answered in the following sections.
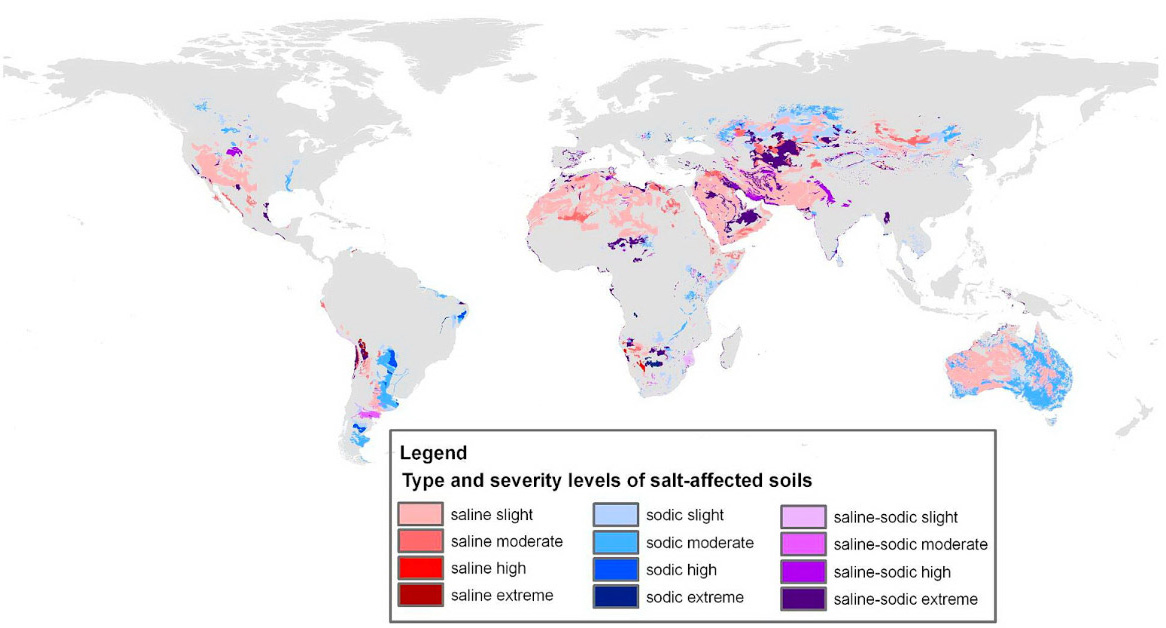
All soils and irrigation waters contain salt. In humid areas—soils, surface waters, and groundwaters—are normally low in salinity. Salt concentrations are minimal because rainfall typically exceeds crop water requirements, which results in dilution of any salts in the soil. The excess water normally percolates through the soil flushing salts below the crop root zone. In dry climates potential evapotranspiration exceeds rainfall. Thus, small amounts of water percolate through the soil to remove salts. With time, the salt content of soils in arid regions may increase and crop yields decrease. When crop productivity is reduced by the presence of excess salt, the soil is said to be salt affected. Documented occurrences of salt-affected soils are illustrated in Figure 7.1. Estimates of the amount of irrigated land impacted by salination are given in Table 7.1 for the world and five selected countries. For detailed information on salinity management refer to Tanji (1990) and Wallender and Tanji (2012).
Figure 7.1. Salt-affected soils across the world (Reproduced from Wicke et al., 2011 with permission from the Royal Society of Chemistry.)
| Country | Area Damaged (million ac) | Share of Irrigated Land Damaged (%) |
|---|---|---|
| India | 50 | 36 |
| China | 18 | 15 |
| United States | 13 | 27 |
| Pakistan | 8 | 20 |
| Former | 6 | 12 |
| World | 150 | 24 |
The primary cause of increasing salt content in soils is evapotranspiration. As water is removed from the soil by plant roots or evaporates from the soil surface, salts are left behind. If salt concentrations become so high that they can no longer be held in solution, precipitation of salt occurs. Precipitation is the chemical process whereby dissolved salts change to their solid form. In the field, precipitated salts appear as a white to gray crust on the soil surface. Figure 7.2 shows salt precipitated on the soil surface in the Imperial Valley of California. Within the soil, nodules or layers of precipitated salts, called caliche, are found in some salt-affected soils. Within the crop root zone the salt concentration is controlled by the ability of the crop’s root system to extract water. This ability is associated with the salt tolerance of the crop.
Figure 7.2. Two bands of salt precipitated out of solution along the top of furrow irrigation beds in California.

The amount and types of salts in soils or waters determine the type of salt problem. The three types are salinity, sodicity, and toxicity. The most widespread problem, caused by the total concentration of dissolved salts, is referred to as salinity. The poor crop stand shown in Figure 7.3 is the result of excess salinity preventing cotton seeds from germinating or killing young seedlings in an Arizona cotton field. The bunches of celery in Figure 7.4 show the impact of salt on crop yield. Salinity, nearly zero on the left, increases progressively to high salt concentrations on the right that almost killed the plant. The impact of salinity on crop growth and yield is associated with osmotic stress, which is measured as osmotic potential (Chapter 2).
Figure 7.3. Loss of cotton plants caused by excess salinity.

Figure 7.4. Impact of increasing salinity (from left to right) on the size of a bunch of celery.

Sodium, present in excess, deteriorates the soil structure and inhibits movement of water into and through the soil. A soil affected by excess sodium is referred to as a sodic soil or, the outmoded term, alkaline soil. Figure 7.5 shows the effects of excess sodium in a corn field in Idaho. The white chunks are precipitated salts and the black areas are organic matter released when the excess sodium destroyed the soil structure. Some crops are sensitive to specific ions such as chloride, boron, sodium, and certain heavy metals in relatively low concentrations. Trees and other woody crops, in particular, are sensitive to specific ions. In these circumstances, excessive concentrations of specific ions are toxic. Figure 7.6 illustrates the toxic effects of three specific ions with considerable potential to damage or adversely affect plants: sodium (Na+ ), chloride (Cl- ), and boron (B).
Figure 7.5. Effect of excess sodium in a corn field. Note the white colored salts and the black organic matter.

Figure 7.6. Leaf burn on trees caused by specific ion toxicity; (a) indicates minimal leaf damage, (b) shows moderate damage, and (c) illustrates significant damage (adapted with permission from Tanji et al., 2007).

The major impact of salinity is a reduction in the osmotic potential caused by the salt concentration of the soil water. As the osmotic potential of the soil water external to the plant decreases (becomes more negative), the difference between the water potential internal and external to the plant roots is reduced. The smaller the difference between internal and external water potentials the higher the degree of difficulty for the roots to extract water from the soil. This phenomenon is frequently noted as a reduction in the availability of water to the plant. As soil water becomes more saline, plants must use more energy to extract soil water. This utilization of energy means less energy for plant growth and the plant becomes smaller and yield is reduced.