
4.4: Information diagrams
- Page ID
- 22999

\( \newcommand{\vecs}[1]{\overset { \scriptstyle \rightharpoonup} {\mathbf{#1}} } \)
\( \newcommand{\vecd}[1]{\overset{-\!-\!\rightharpoonup}{\vphantom{a}\smash {#1}}} \)
\( \newcommand{\id}{\mathrm{id}}\) \( \newcommand{\Span}{\mathrm{span}}\)
( \newcommand{\kernel}{\mathrm{null}\,}\) \( \newcommand{\range}{\mathrm{range}\,}\)
\( \newcommand{\RealPart}{\mathrm{Re}}\) \( \newcommand{\ImaginaryPart}{\mathrm{Im}}\)
\( \newcommand{\Argument}{\mathrm{Arg}}\) \( \newcommand{\norm}[1]{\| #1 \|}\)
\( \newcommand{\inner}[2]{\langle #1, #2 \rangle}\)
\( \newcommand{\Span}{\mathrm{span}}\)
\( \newcommand{\id}{\mathrm{id}}\)
\( \newcommand{\Span}{\mathrm{span}}\)
\( \newcommand{\kernel}{\mathrm{null}\,}\)
\( \newcommand{\range}{\mathrm{range}\,}\)
\( \newcommand{\RealPart}{\mathrm{Re}}\)
\( \newcommand{\ImaginaryPart}{\mathrm{Im}}\)
\( \newcommand{\Argument}{\mathrm{Arg}}\)
\( \newcommand{\norm}[1]{\| #1 \|}\)
\( \newcommand{\inner}[2]{\langle #1, #2 \rangle}\)
\( \newcommand{\Span}{\mathrm{span}}\) \( \newcommand{\AA}{\unicode[.8,0]{x212B}}\)
\( \newcommand{\vectorA}[1]{\vec{#1}} % arrow\)
\( \newcommand{\vectorAt}[1]{\vec{\text{#1}}} % arrow\)
\( \newcommand{\vectorB}[1]{\overset { \scriptstyle \rightharpoonup} {\mathbf{#1}} } \)
\( \newcommand{\vectorC}[1]{\textbf{#1}} \)
\( \newcommand{\vectorD}[1]{\overrightarrow{#1}} \)
\( \newcommand{\vectorDt}[1]{\overrightarrow{\text{#1}}} \)
\( \newcommand{\vectE}[1]{\overset{-\!-\!\rightharpoonup}{\vphantom{a}\smash{\mathbf {#1}}}} \)
\( \newcommand{\vecs}[1]{\overset { \scriptstyle \rightharpoonup} {\mathbf{#1}} } \)
\( \newcommand{\vecd}[1]{\overset{-\!-\!\rightharpoonup}{\vphantom{a}\smash {#1}}} \)
\(\newcommand{\avec}{\mathbf a}\) \(\newcommand{\bvec}{\mathbf b}\) \(\newcommand{\cvec}{\mathbf c}\) \(\newcommand{\dvec}{\mathbf d}\) \(\newcommand{\dtil}{\widetilde{\mathbf d}}\) \(\newcommand{\evec}{\mathbf e}\) \(\newcommand{\fvec}{\mathbf f}\) \(\newcommand{\nvec}{\mathbf n}\) \(\newcommand{\pvec}{\mathbf p}\) \(\newcommand{\qvec}{\mathbf q}\) \(\newcommand{\svec}{\mathbf s}\) \(\newcommand{\tvec}{\mathbf t}\) \(\newcommand{\uvec}{\mathbf u}\) \(\newcommand{\vvec}{\mathbf v}\) \(\newcommand{\wvec}{\mathbf w}\) \(\newcommand{\xvec}{\mathbf x}\) \(\newcommand{\yvec}{\mathbf y}\) \(\newcommand{\zvec}{\mathbf z}\) \(\newcommand{\rvec}{\mathbf r}\) \(\newcommand{\mvec}{\mathbf m}\) \(\newcommand{\zerovec}{\mathbf 0}\) \(\newcommand{\onevec}{\mathbf 1}\) \(\newcommand{\real}{\mathbb R}\) \(\newcommand{\twovec}[2]{\left[\begin{array}{r}#1 \\ #2 \end{array}\right]}\) \(\newcommand{\ctwovec}[2]{\left[\begin{array}{c}#1 \\ #2 \end{array}\right]}\) \(\newcommand{\threevec}[3]{\left[\begin{array}{r}#1 \\ #2 \\ #3 \end{array}\right]}\) \(\newcommand{\cthreevec}[3]{\left[\begin{array}{c}#1 \\ #2 \\ #3 \end{array}\right]}\) \(\newcommand{\fourvec}[4]{\left[\begin{array}{r}#1 \\ #2 \\ #3 \\ #4 \end{array}\right]}\) \(\newcommand{\cfourvec}[4]{\left[\begin{array}{c}#1 \\ #2 \\ #3 \\ #4 \end{array}\right]}\) \(\newcommand{\fivevec}[5]{\left[\begin{array}{r}#1 \\ #2 \\ #3 \\ #4 \\ #5 \\ \end{array}\right]}\) \(\newcommand{\cfivevec}[5]{\left[\begin{array}{c}#1 \\ #2 \\ #3 \\ #4 \\ #5 \\ \end{array}\right]}\) \(\newcommand{\mattwo}[4]{\left[\begin{array}{rr}#1 \amp #2 \\ #3 \amp #4 \\ \end{array}\right]}\) \(\newcommand{\laspan}[1]{\text{Span}\{#1\}}\) \(\newcommand{\bcal}{\cal B}\) \(\newcommand{\ccal}{\cal C}\) \(\newcommand{\scal}{\cal S}\) \(\newcommand{\wcal}{\cal W}\) \(\newcommand{\ecal}{\cal E}\) \(\newcommand{\coords}[2]{\left\{#1\right\}_{#2}}\) \(\newcommand{\gray}[1]{\color{gray}{#1}}\) \(\newcommand{\lgray}[1]{\color{lightgray}{#1}}\) \(\newcommand{\rank}{\operatorname{rank}}\) \(\newcommand{\row}{\text{Row}}\) \(\newcommand{\col}{\text{Col}}\) \(\renewcommand{\row}{\text{Row}}\) \(\newcommand{\nul}{\text{Nul}}\) \(\newcommand{\var}{\text{Var}}\) \(\newcommand{\corr}{\text{corr}}\) \(\newcommand{\len}[1]{\left|#1\right|}\) \(\newcommand{\bbar}{\overline{\bvec}}\) \(\newcommand{\bhat}{\widehat{\bvec}}\) \(\newcommand{\bperp}{\bvec^\perp}\) \(\newcommand{\xhat}{\widehat{\xvec}}\) \(\newcommand{\vhat}{\widehat{\vvec}}\) \(\newcommand{\uhat}{\widehat{\uvec}}\) \(\newcommand{\what}{\widehat{\wvec}}\) \(\newcommand{\Sighat}{\widehat{\Sigma}}\) \(\newcommand{\lt}{<}\) \(\newcommand{\gt}{>}\) \(\newcommand{\amp}{&}\) \(\definecolor{fillinmathshade}{gray}{0.9}\)In this chapter we move from tasks to information by transforming the process diagram into an information diagram: a digraph of information instances and related actions and transactions. Information diagrams represent the information side of management, which both operationalizes and validates a process design. This chapter builds on the chapter on process diagrams and presupposes knowledge of graphs, in particular digraphs (see Appendix I).
Process operationalization
Process diagrams are essential for the social side of management: they tell us who is doing what and when, in an overview that supports both zooming in or out and tracking the contributions or interests of each stakeholder. What they do not do is specify tasks in terms of content and structure. For example, they tell us that we need a design to make a cost estimate but not exactly what the design should contain, which aspects of the design relate to costs, how these aspects are processed towards a cost estimate and what should be included in the cost estimate. Leaving this operationalization of the process design to the discretion of the actors inevitably causes uncertainties and conflicts that undermine the process and its management.
Translating the process diagram into information instances and actions makes the individual tasks operational and unambiguous at a practical level, so that every participant knows exactly what to expect and do. This guides implementation and allows for evaluation and control throughout the process. For example, a task like “calculate the net area of a room” becomes a matter of obtaining a complete and truthful description of the room, including all dimensions of the room as well as of any obstacles that should be subtracted from it, making the necessary calculations and producing either a total area measurement or an analytical list of measurements that includes obstacles. At this level, there is little if any room for omissions or misunderstandings and we can easily ascertain if things are done correctly. The actor who makes the calculation has clear expectations concerning the room description another actor delivers and equally clear instructions as to how the calculation results should be communicated. How the calculation is made (with a computer, a calculator, an abacus or mentally) is usually a matter for the actor, their capacities in relation to the demands of the task and applicable professional standards.
Such specificity is necessary for the information side of management: the guidance and control of a process on the basis of what actors produce and consume in it. It is also essential with respect to digitization: it ensures that the use of digital resources is meaningful and constructive. Quite often digitization is managed by imposing standards and restrictions on the means. For example, we can stipulate that building designs should be made in BIM but this does not help achieve the performance promised by BIM. We must also stipulate what constitutes proper and acceptable usage of BIM. In fact, it should not matter which software or approach is used if the requirements of the deliverables are met: design representations with the right content and a structure that facilitates retrieval and processing of this content. An information diagram that bypasses all assumptions concerning digitization means and approaches, and describes what should be done with precision and accuracy not only supports IM but also explains why e.g. BIM is required rather than CAD.
Finally, expressing a process in terms of specific information is helpful in avoiding “mental shotgun” situations: when confronted with unexpected problems, we tend to confound our Type 2 processes by mentally computing too much information, clearly more than we need or is relevant to the issues at hand. Panic is often the cause of the mental shotgun, as well as its effect. To countermand this, we must be clear not only concerning which data are relevant to each task but also how these derive from primary data and how primary and derivative data are structured in the representations we use. This facilitates identification of pertinent information and its provenance even under unforeseen circumstances, so that decisions can be taken and evaluated without confusion or uncertainty.
From process to information diagram: I-P-O
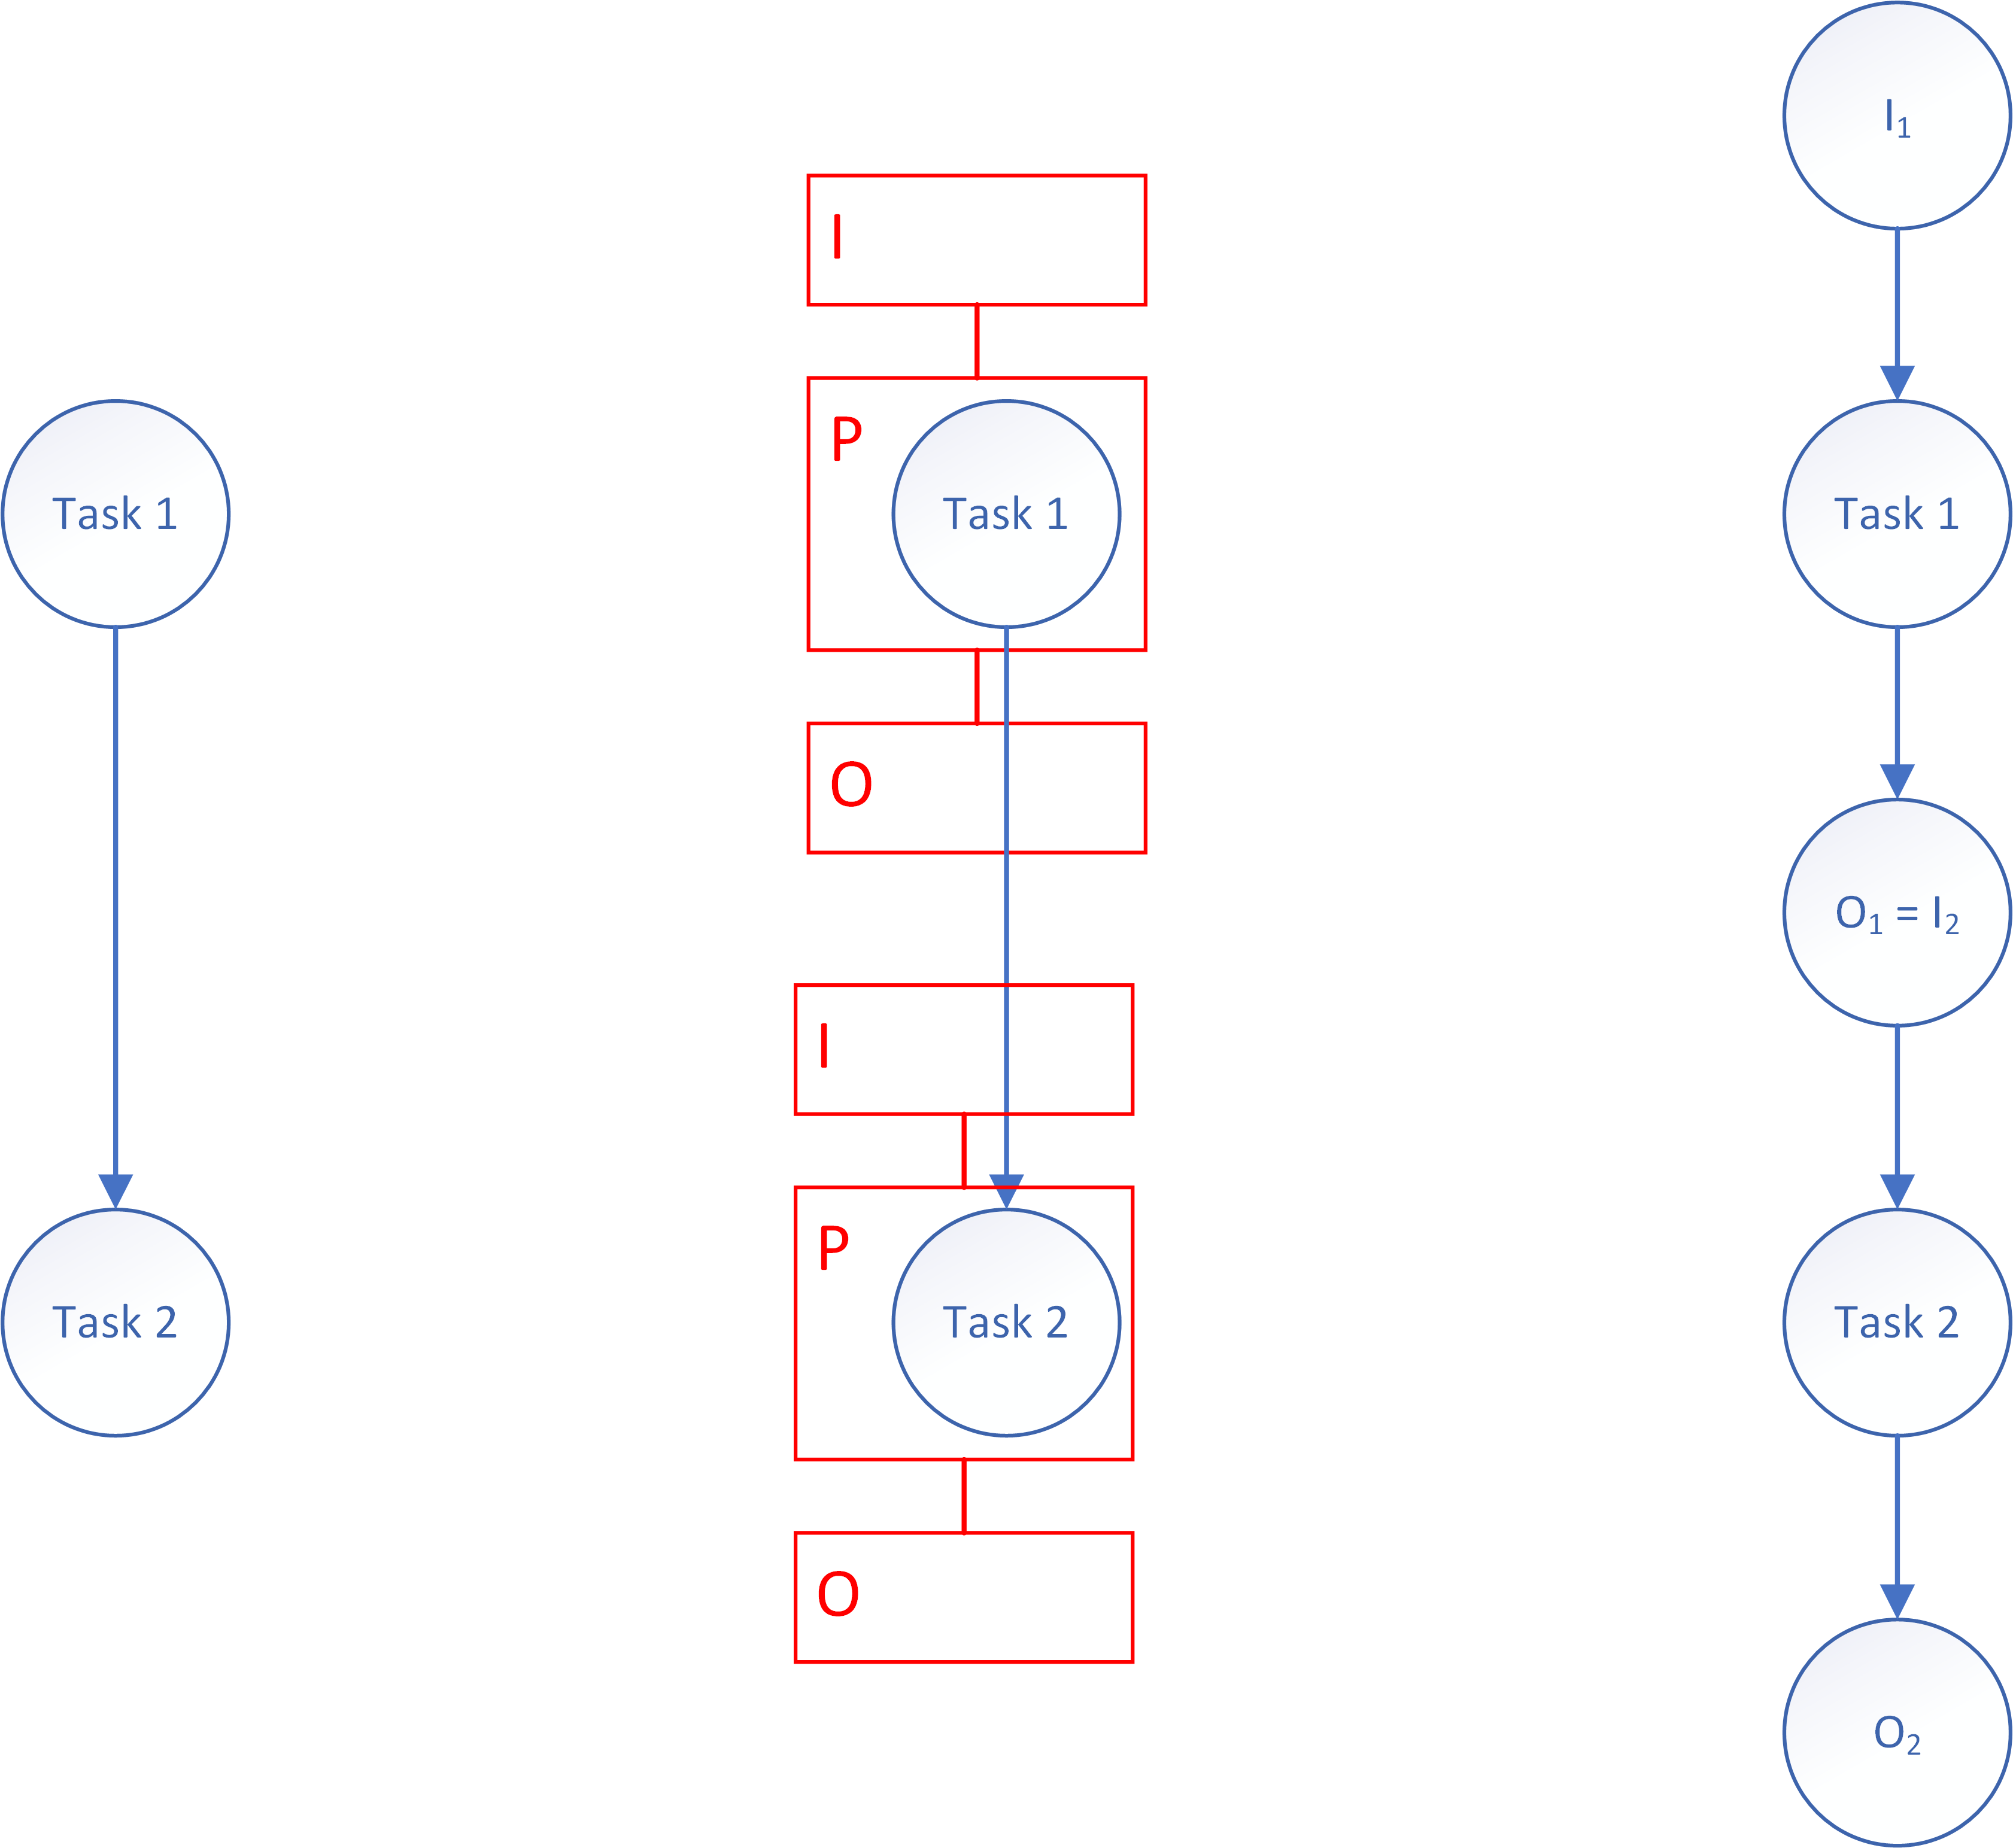
The transition from process to information diagram starts by superimposing the I-P-O scheme on each task, with the P on the task node (Figure 1). This expresses what takes place in the task in information-processing terms by adding an input node before and an output node after the task. Usually, the output of a task becomes direct input to the following task, so only a single node needs to be added between the two. Note that this is not always the case: the output of a task may connect to more tasks, in ways not anticipated in the process diagram. Similarly, the input of a task may merge the output of several other tasks.
The process diagram may also miss nodes that describe external sources, for example the published unit prices a cost specialist uses or reference projects for the brief or budget. The same applies to the outcomes of a process: design approval usually implies some information deliverables, such as a representation of the approved design. These nodes must be added to the information diagram, too.
In general, the transformation of a process diagram amounts to the following graph operations:
- Subdivision of arcs to introduce nodes for their input and output
- Splitting of process diagram sources to create nodes that represent the input to these tasks
- Splitting of process diagram terminals to create nodes that represent the output of these tasks
Alternatively, the first point can be expressed more precisely as:
- Splitting of each task node twice to create one node for its input and one for its output
- Contraction of edges between input and output nodes that respectively have an in- and out-degree of 1
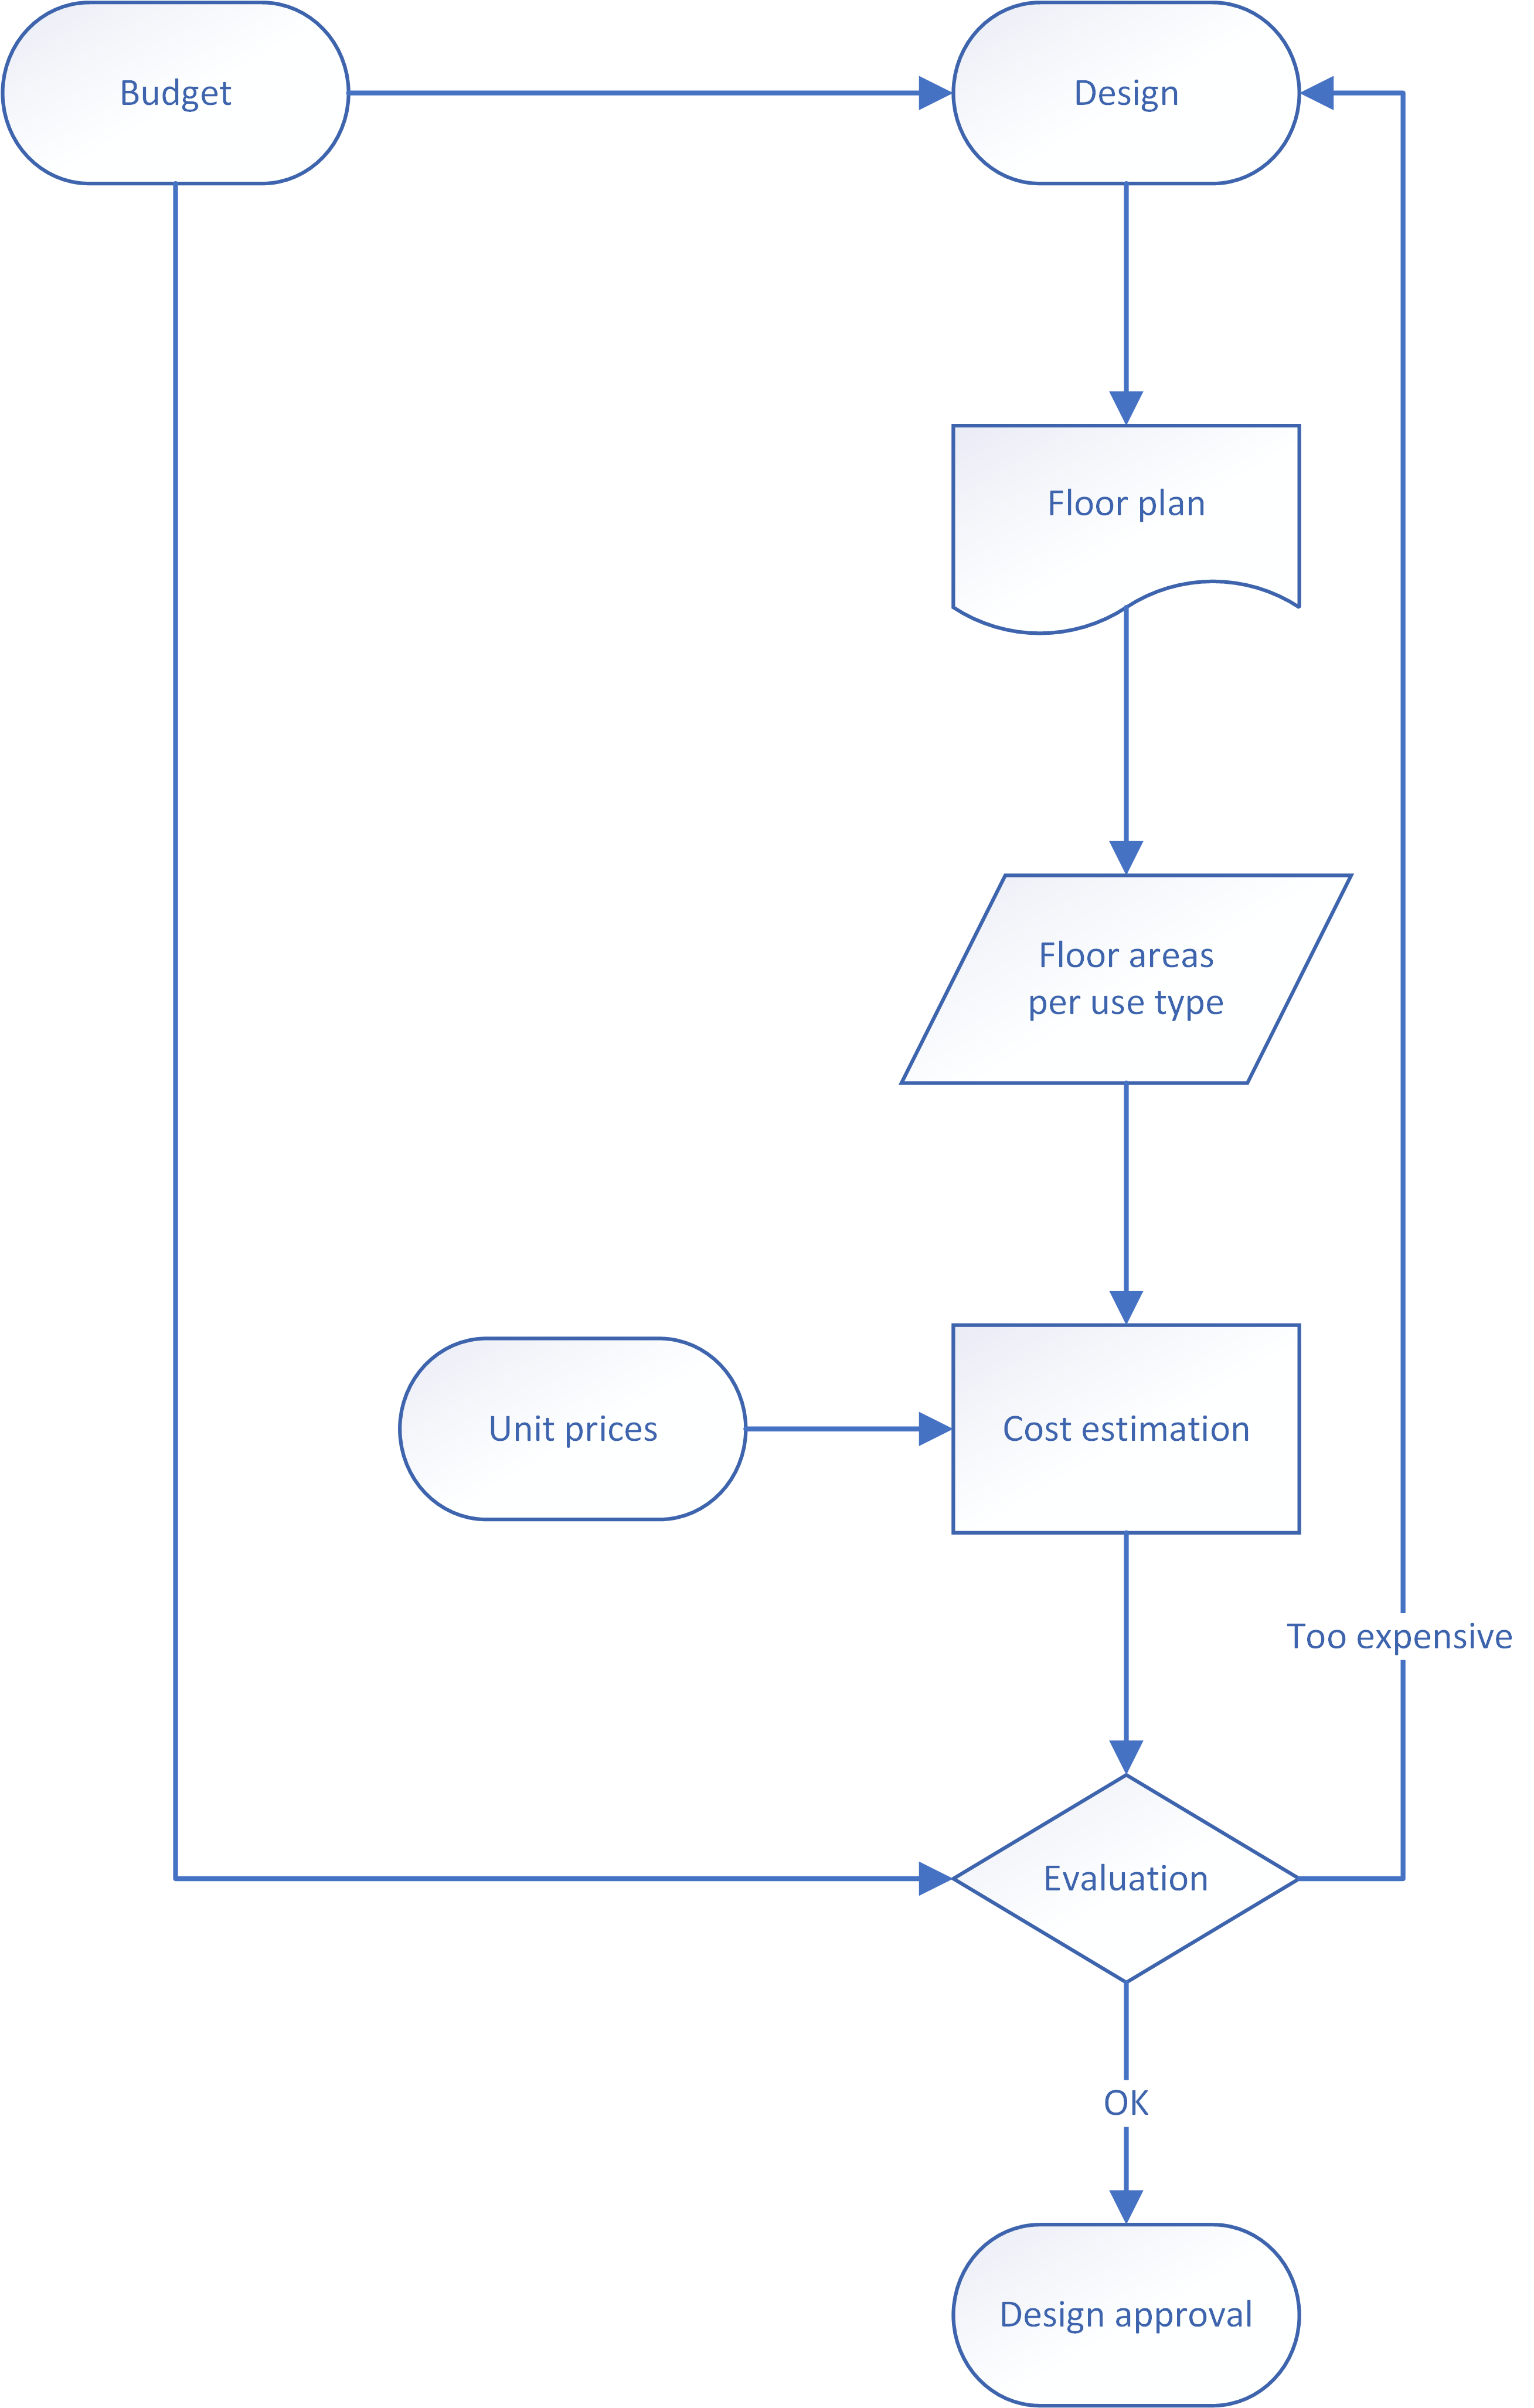
The input and output nodes in an information diagram must be made as specific as possible. The design node in Figure 2 is expected to contribute to a cost estimation involving gross floor areas. This means that the design cannot exist solely in the architect’s mind; we need some external representation as input, on the basis of which we can measure floor areas, moreover by use category (as these have different unit prices). The obvious candidate is a floor plan and, more precisely, one where all spaces are indicated and labelled by their use. This floor plan rather than some abstract notion of a design is the appropriate input for the processing we require (calculation of gross floor areas). In the same manner, one can establish that these areas are the output of a new task, as well as the input to the next processing step (cost estimation).
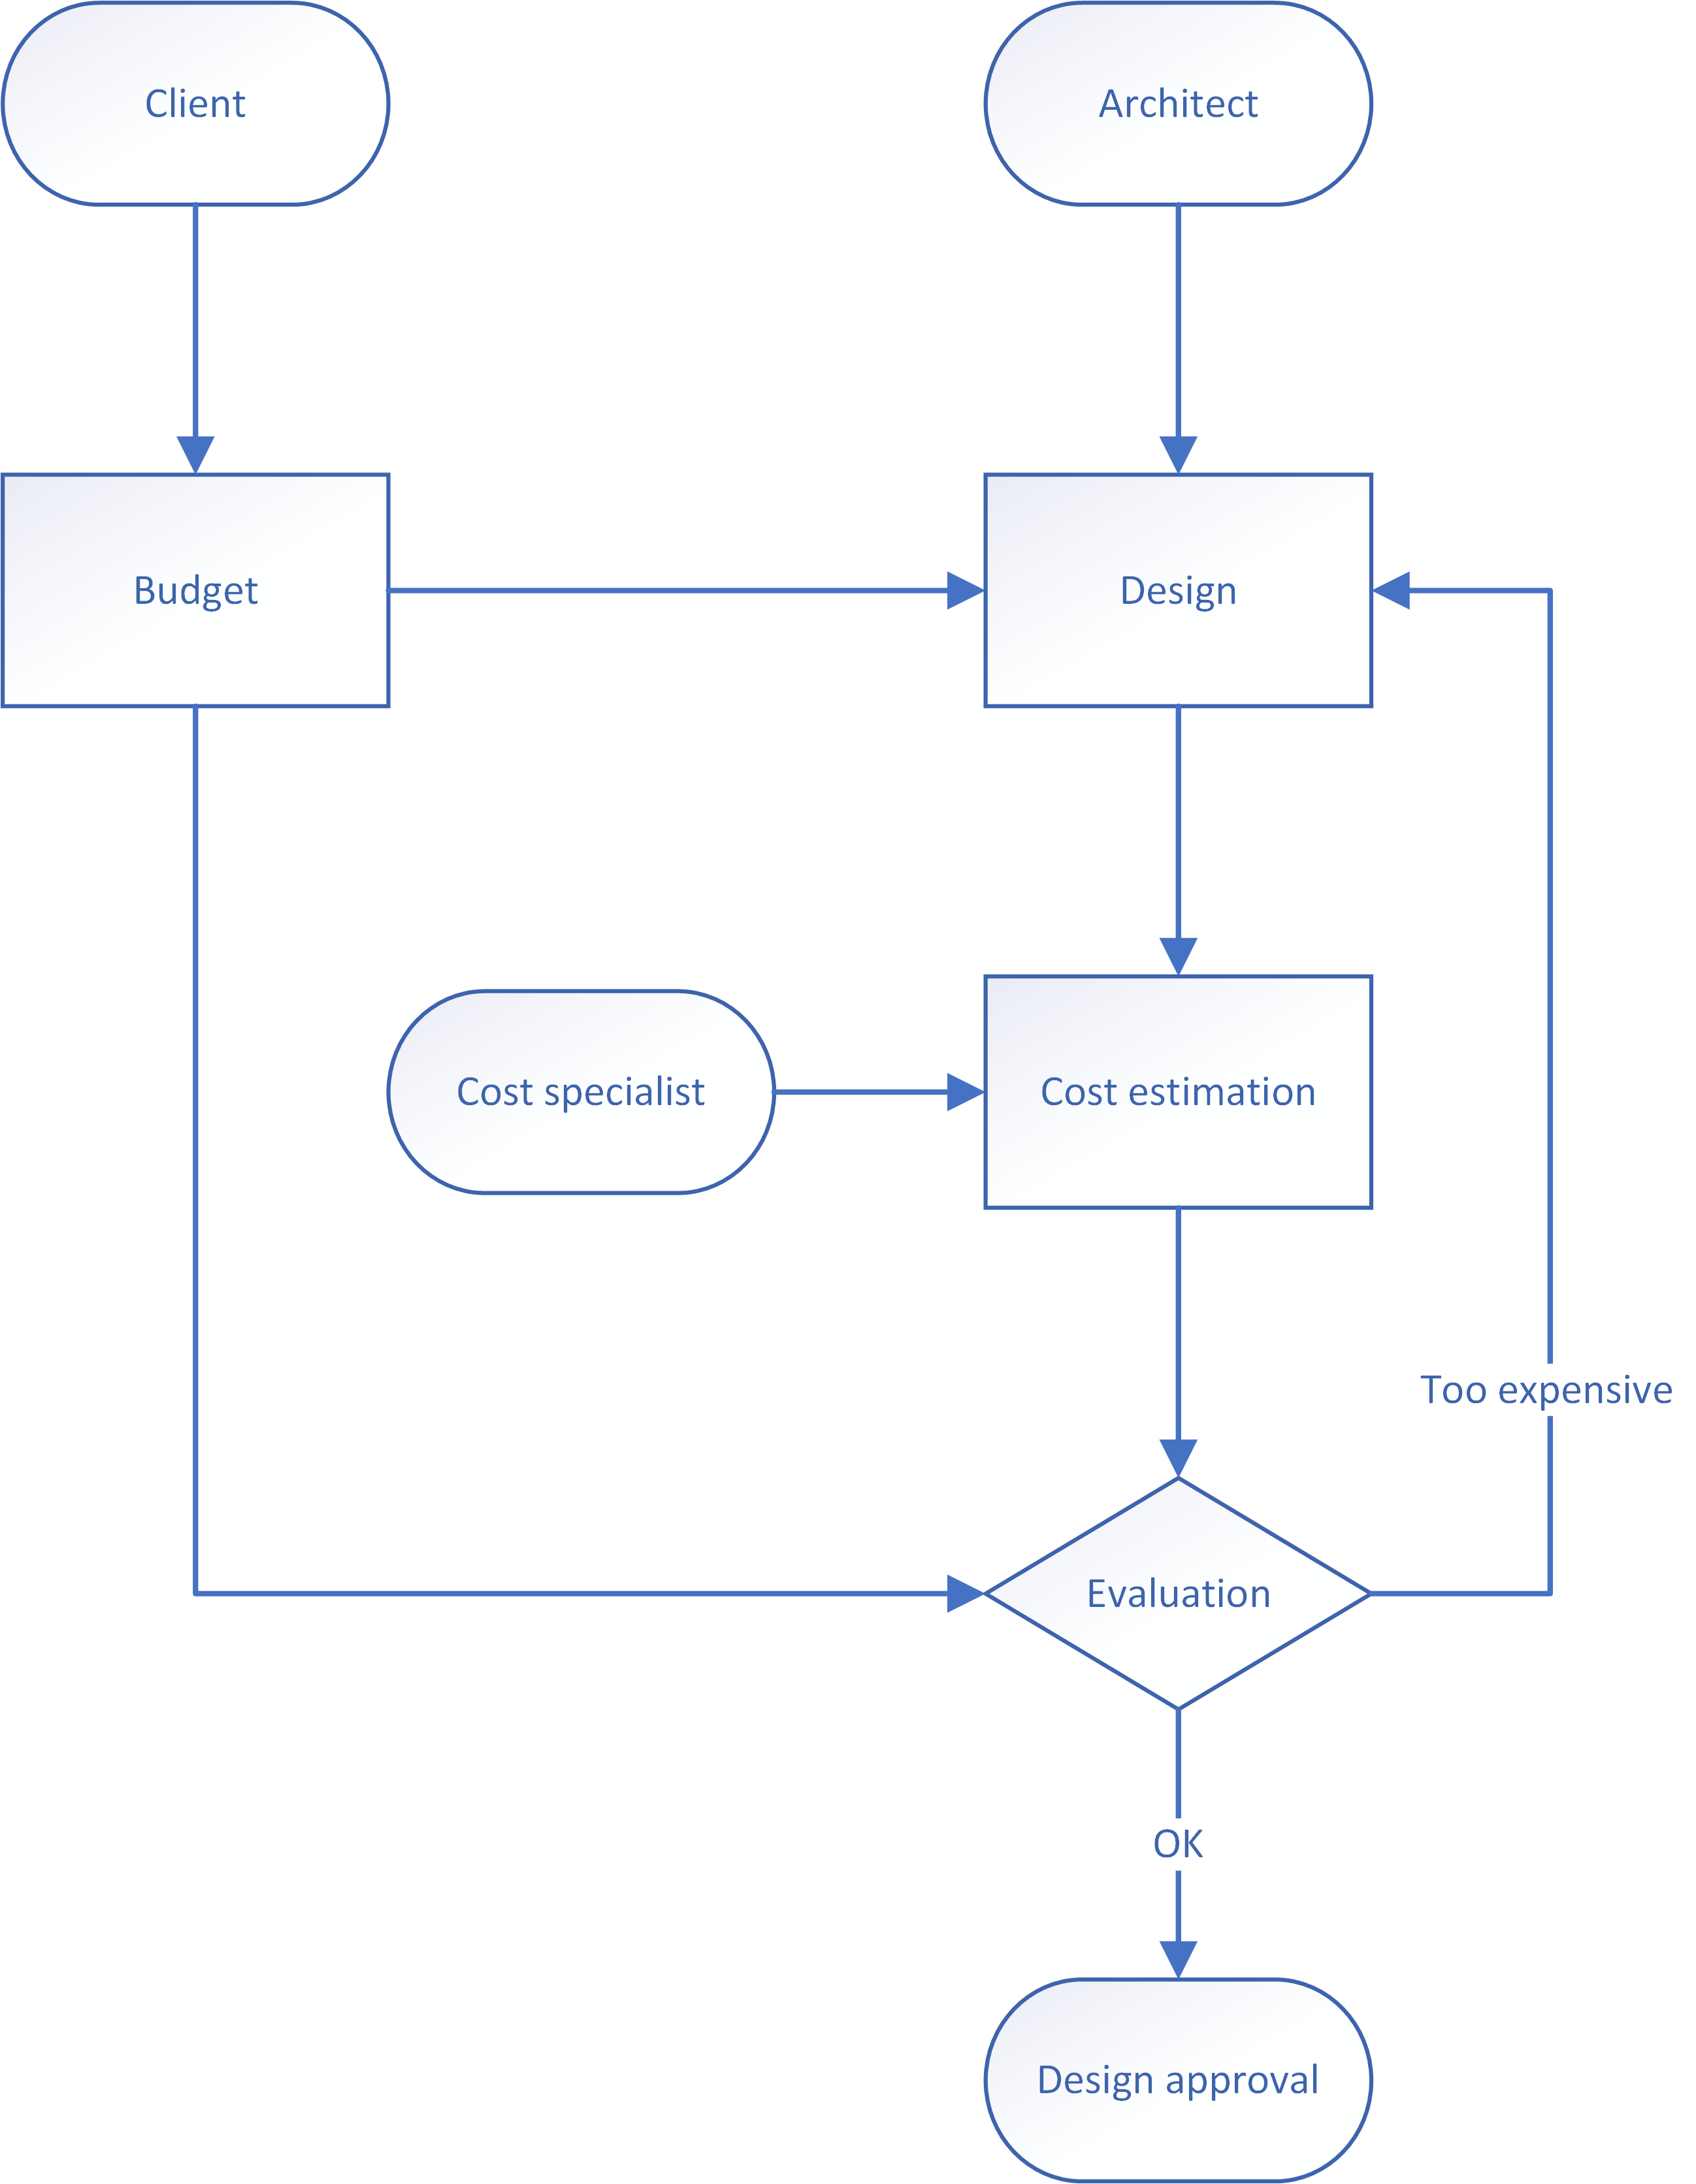
Figure 3 illustrates the results of the transformation. Between design and cost estimation it was necessary to insert two nodes, so as to be quite specific concerning the input to the cost estimation calculations. Note that in this way some tasks are attached to the arcs: the information diagram does not specify how the floor plan is produced from the design or how the floor areas are calculated in the floor plan. This is because emphasis is now firmly on what (information); how, as the remit of the actors, is assumed to be known or standardized and, in any case, constrained by the specified output. Similarly, the actor / stakeholder nodes have been removed in order to put emphasis on task and information nodes, as well as save space. In this version, who determines the budget, who makes the design and who calculates the cost estimate is implicit in their tasks and products but, at the same time, unambiguous. If this is not the case and there are multiple actors or stakeholders involved in different tasks with varying capacities, it is advisable to keep them in the information diagram, too, so that there can be no misunderstanding as to e.g. which designer or engineer is responsible for each design aspect. Referring to the process diagram concerning such matters is less practical; the information diagram should be self-sufficient and self-explanatory.
The uniqueness rule applies to information diagrams, too: each object should appear only once, as a single node. So, if the design must be improved because the design is deemed too expensive, the diagram should contain a feedback arc to the design. On the other hand, if the cost evaluation leads to a radically new design, requiring a new node in the diagram, then this should be made clear by means of unambiguous node labelling (e.g. Design 1 and Design 2). Such new versions of the same nodes should be used cautiously and sparingly, only when absolutely necessary, e.g. when a process involves design alternatives. Feedback to the floor plan is also possible but not if it is the design that must be improved: any feedback to an information node is normally due to quality issues, e.g. if the floor plan contains no indications of use type. Such feedback is not part of process diagrams but information diagrams must include controls of information quality, too.
The other two rules of process diagrams, the decision degrees and the specificity and comprehensiveness rules, also apply to information diagrams, even more strictly. What may be excused as pragmatic fuzziness and abstraction in a process diagram is unacceptable and undermining in an information diagram. For example, it is necessary in Figure 3 to indicate that what is measured in the floor plan are the floor areas of different uses because the cost estimation applies different unit prices to each type of building use. One m2 of storage area costs significantly less than one m2 of office space, which in turn costs less than one m2 of an operating theatre in a hospital. This means that it is not enough to calculate the total gross floor area of a hospital design; one has to know the use of every space, so as to be able to calculate the subtotals for each type. The subtotals are then multiplied by the unit prices to arrive at a correct estimate and ascertain which category may be too big or too costly. In an evaluation, it is imperative that the things that are compared are similarly unambiguously specified. If, for example, the hospital budget has separate chapters for each use type, it should be clear how the comparison takes place (e.g. per use type or per building part, which may include various types).
The example illustrates the key differences between process and information diagrams: the former can be abstract about what each task entails and focus on process flow but the latter has to be specific regarding information sources (e.g. which drawings are used), the information instances these sources accommodate and the actions through which these instances are processed. The higher specificity of information diagrams leads to a finer grain in the analysis of the process, resulting in nodes and arcs that allow one to be even more precise and hence certain about information flow, as well as safeguard information quality. While in general the flow is the same in both diagrams, the higher specificity of the information diagram may lead to new insights and local elaborations or changes in the process design.
One such elaboration is the analysis of the design node in the process diagram into a sequence of nodes (design, floor plan, floor areas per use type) in the information diagram. Such expansion is generally necessary at critical points of a process. Similarly, in making an information diagram one should pay particular attention to nodes with a high in- or out-degree in the process diagram. These indicate tasks of high complexity and density, which should possibly be analysed into several tasks in the information diagram, provided that this does not undermine parallel or integrated decision processes. As a rule of thumb, the results of such an expansion in an information diagram should include a large number of arcs between the new nodes, expressing the complexity of the task represented by the original node.
Information diagrams for BIM
Until now, we have discussed information diagrams as if we were in the previous century, working with analogue representations and their digital facsimiles. This is a far cry from the symbolic representations that form the present and predictable future of digitization in AECO. Adapting our example of the cost estimation to BIM means first of all that the model (the central information system) should be explicitly present in the diagram. This information system contains the symbols and relations in which primary data are found. Derivative data like floor area calculations are produced from the model and presented in views like schedules. These schedules are typically predefined in various formats, including room schedules that list spaces and their properties, including floor area calculations (Figure 4).
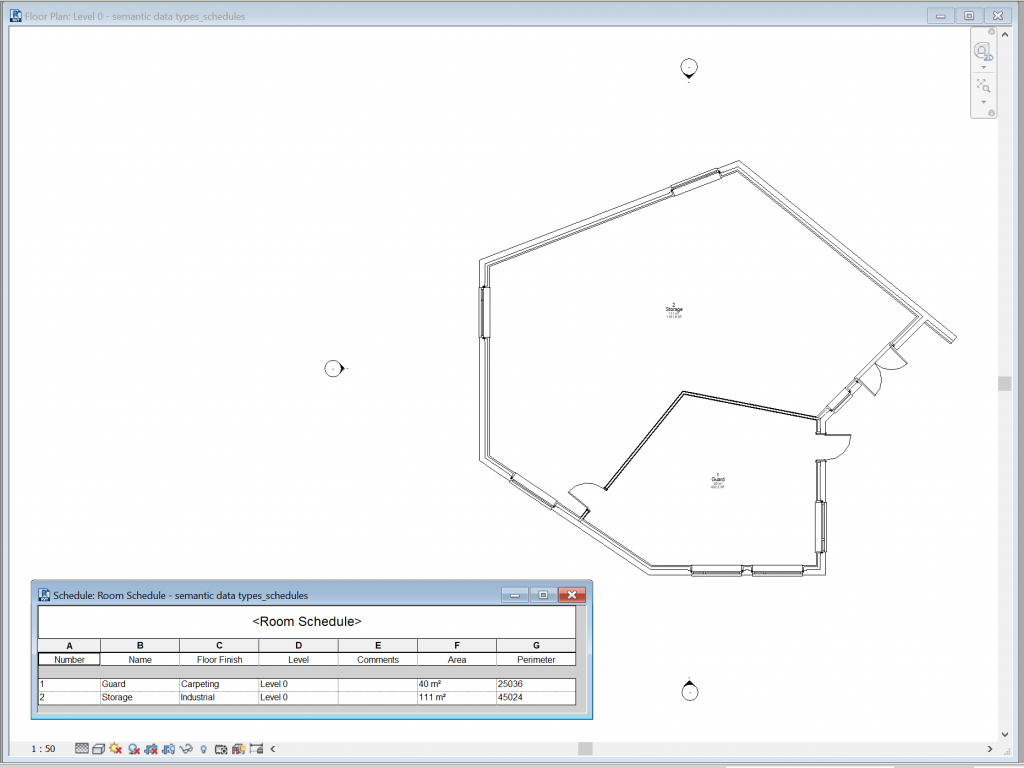
Room schedules can be used to verify that the model contains all primary data needed for the cost estimation, i.e. the spaces, their dimensions and use types. They can also be expanded with unit prices and subsequent calculations, thus integrating cost estimation in BIM in a straightforward and transparent manner (Figure 5).
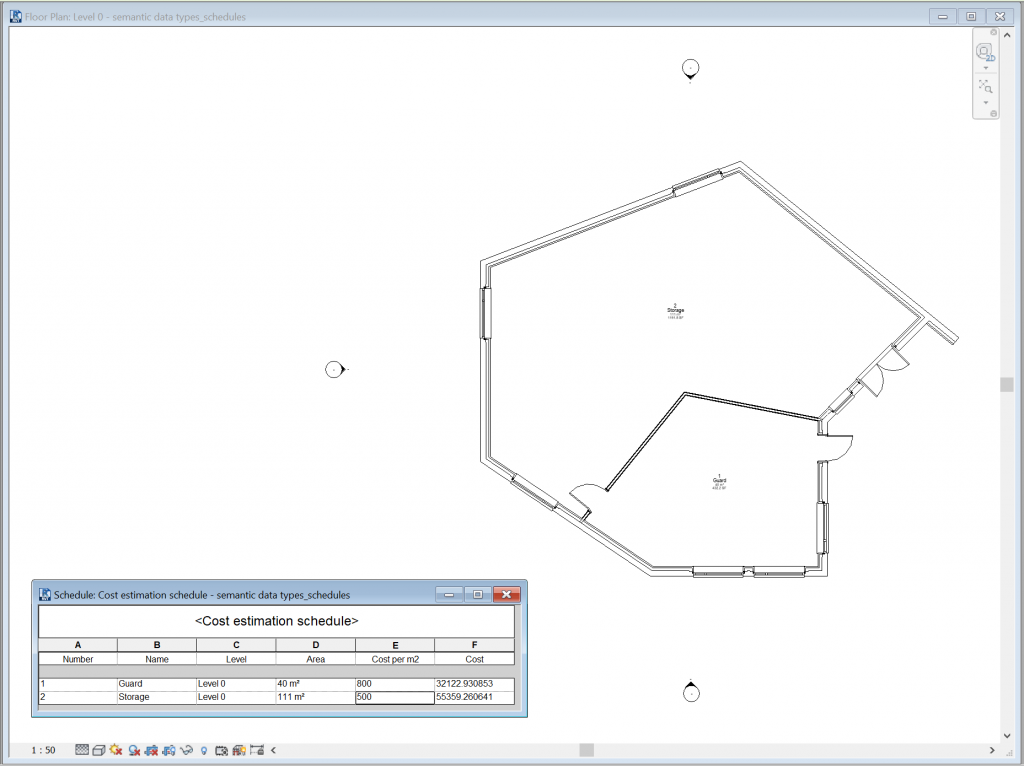
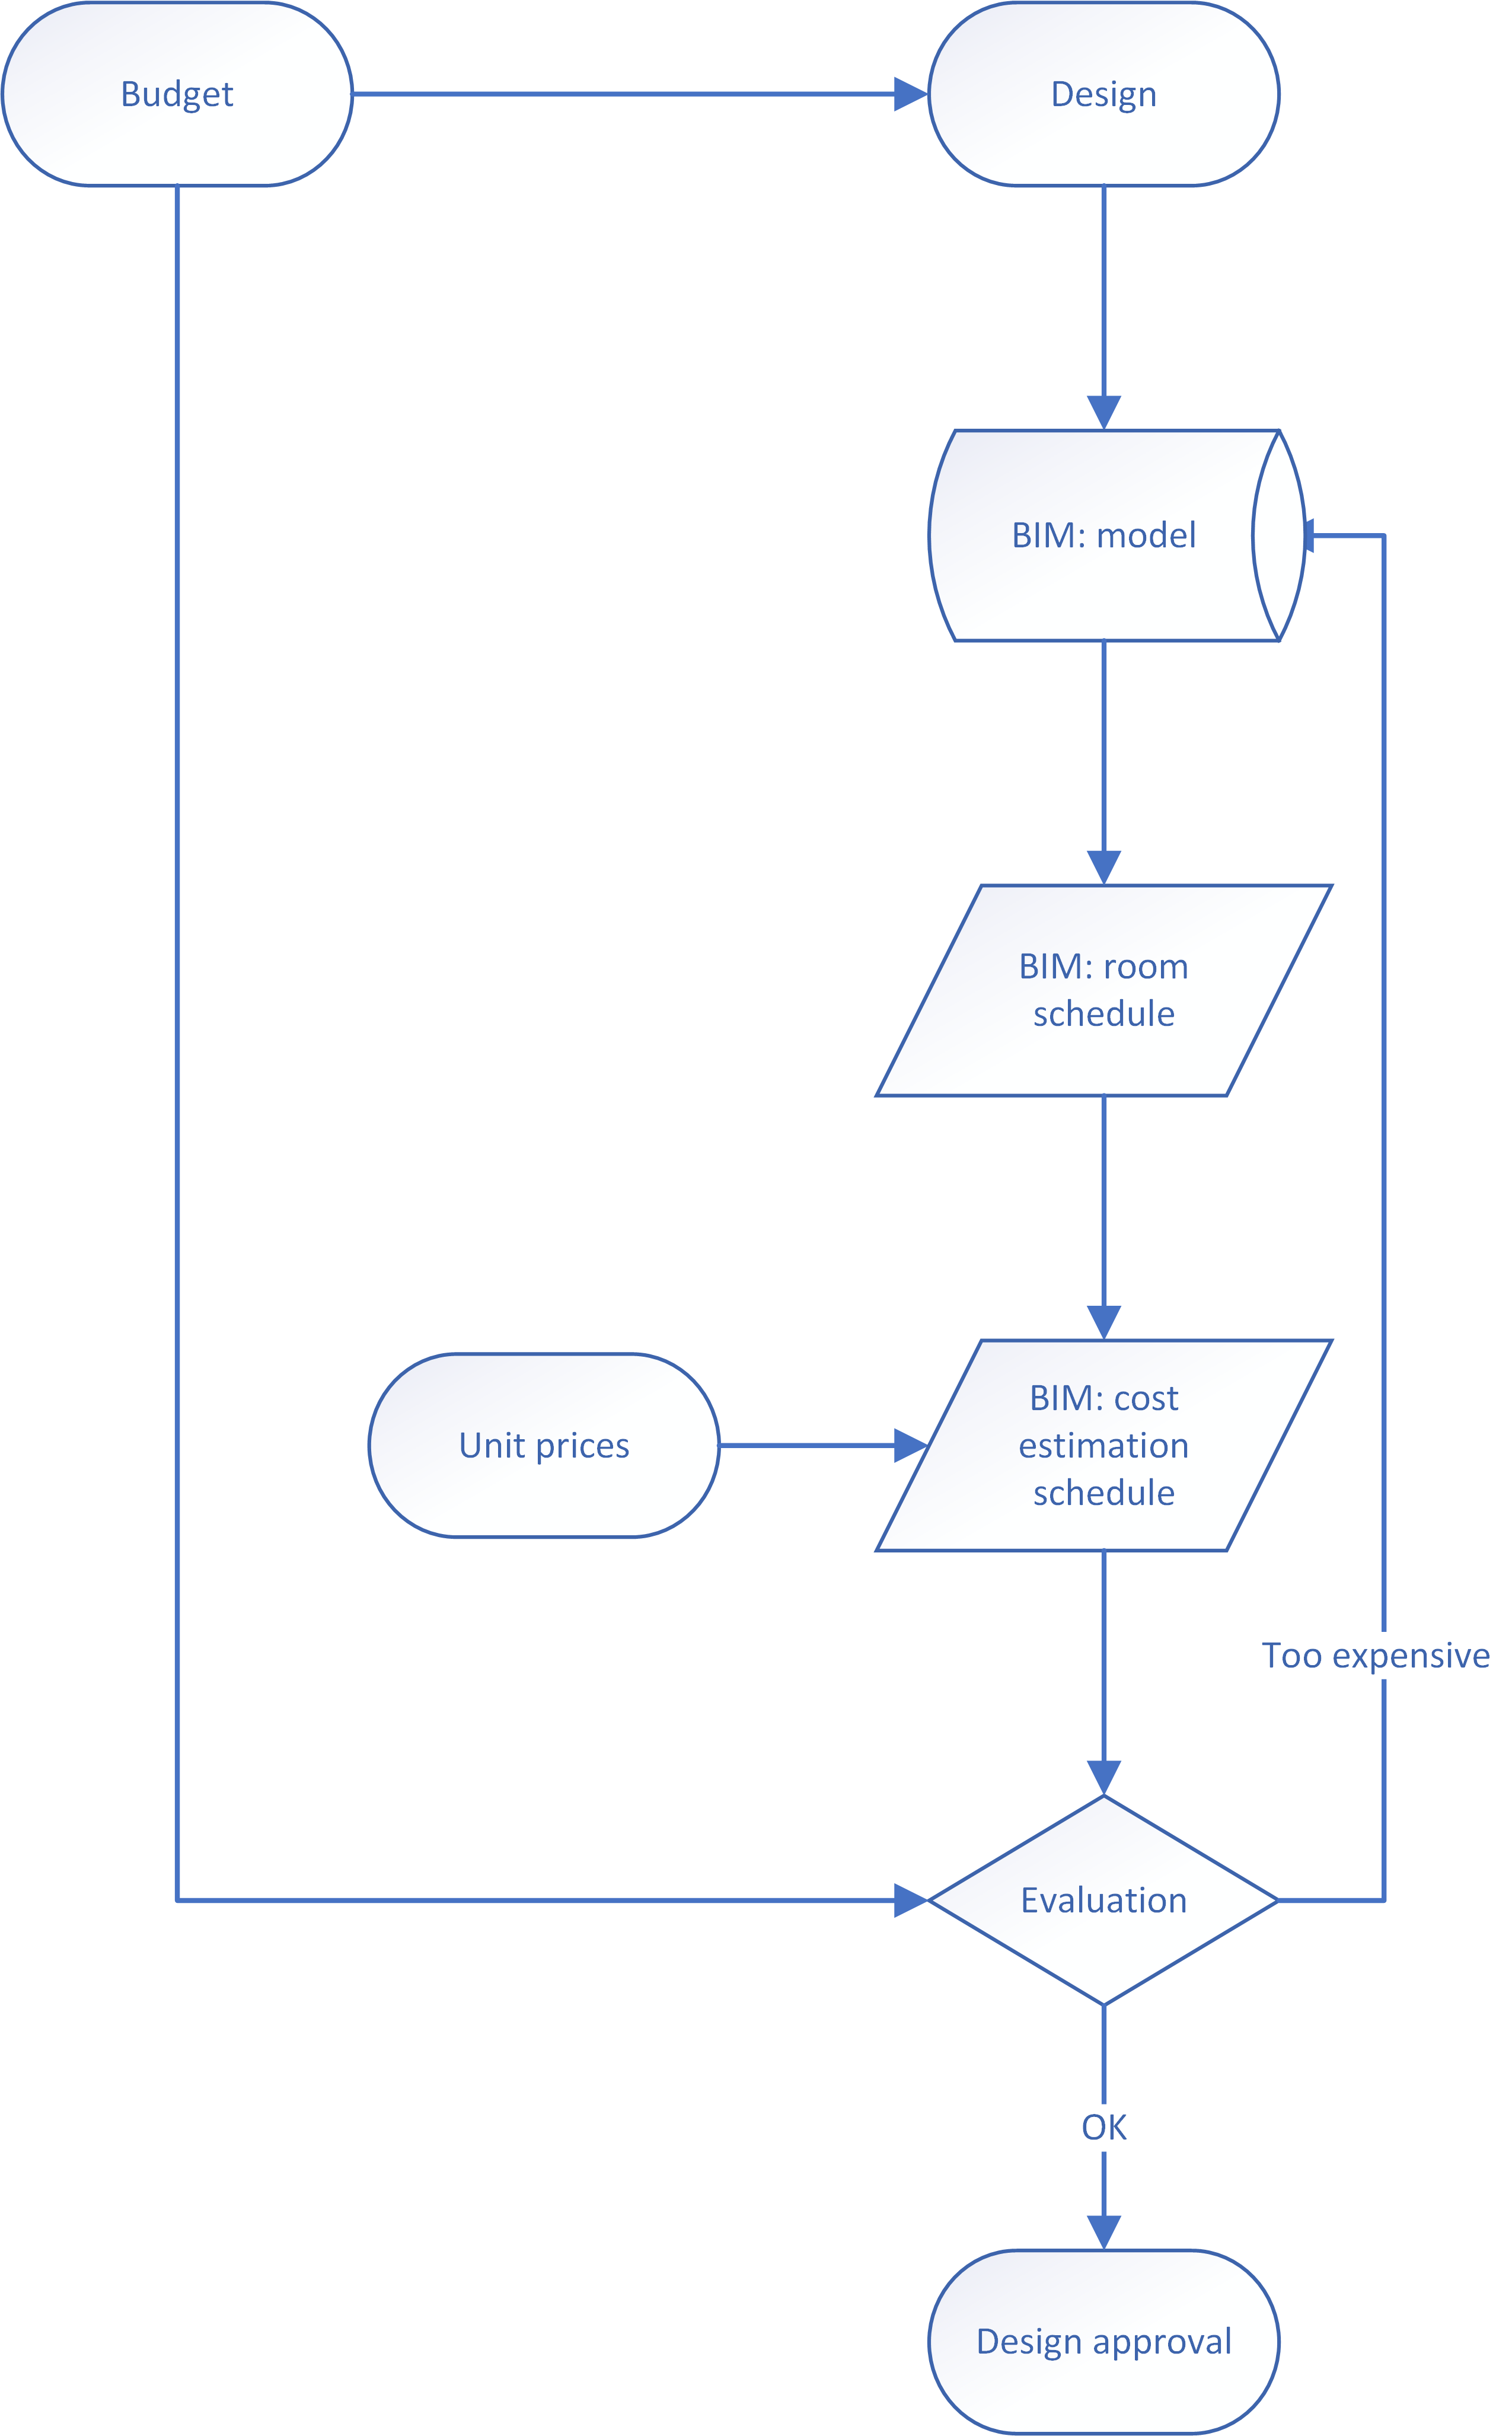
Figure 6 is the information diagram for cost estimation in BIM. Interestingly, it is not significantly different from Figure 3, only feedback goes to the design representation rather than an abstract design node. Collaboration in BIM means that information processed by all actors resides permanently in a single, central representation. The properties and relations of symbols that accommodate this information cannot be detached from the representation, as was the custom with analogue information carriers, where each discipline had its own drawings of the same design. In BIM, any information action or transaction starts from the model and is usually followed by feedback to the model (with the exception of terminal nodes). This means that feedback should be specific, i.e. directed at the space symbols in the model, which could accommodate it as annotations or, preferably, constraints on properties and relations. By being specific about which symbols, properties and relations are affected, one can guide information actions with precision and certainty, avoiding the dangers of improvised interpretations by confused actors.
In general, any connection to a model in BIM, either output or input, should refer to specific symbols rather than the representation in general. For example, if an evaluation results in a decision to improve the thermal insulation of a building, the feedback from the evaluation should connect to the symbols of the particular building elements that must be improved, such as the windows or the roof. Views in BIM, such as schedules or floor plans, are for analysis and communication, hence serve as output from the model or as environments for processing. Input to the model (including feedback) should therefore not connect to views but to symbols in the model. In this respect, it is advisable to represent views in information diagrams in a way that reminds you that they do not normally accept input.
In our example, the unit prices are connected to the model through a schedule, i.e. a view: they do not become properties of space symbols. The reasoning behind this choice is that unit prices are values that relate to aggregates: sums that abstract the specific circumstances of each symbol in order to approximate averages. As such, they are derivative data that do not merit inclusion among the primary properties of a symbol. Their connection to a view indicates that they are temporarily linked to the model rather than integrated in it.
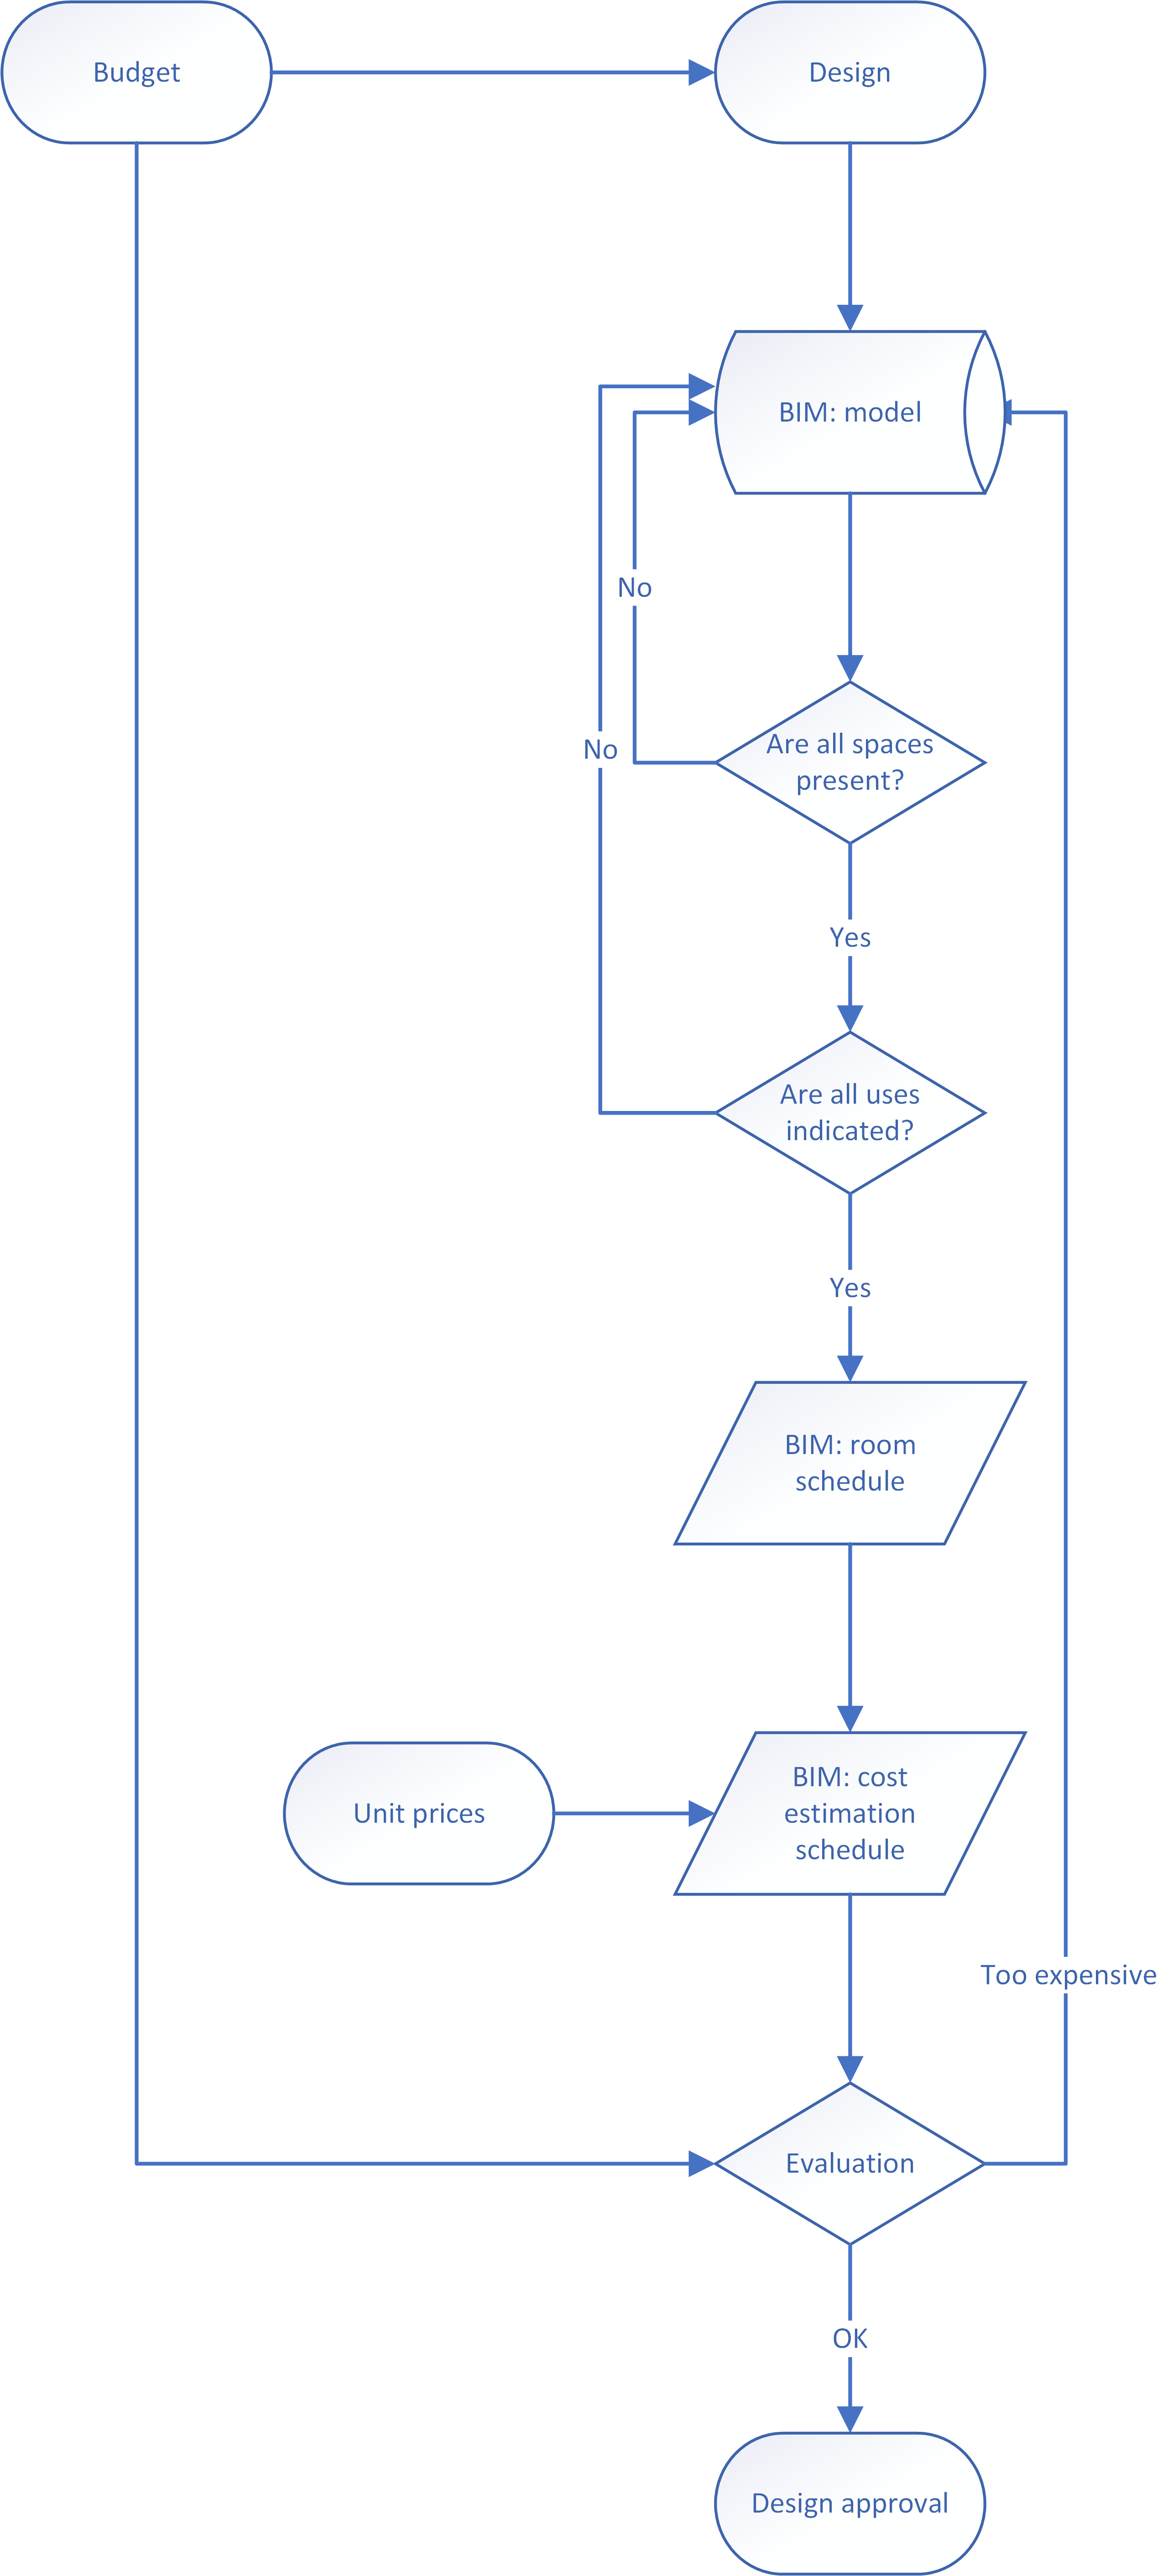
As an indication of the level of detail possible and frequently necessary in IM, Figure 7 is a variation of the same information diagram with a couple of information quality controls added. The controls concern the presence of essential information (the space symbols) and primary properties of these symbols (use type). Note that while the diagram is specific about which symbols and properties are concerned, it is elliptical about how the controls are implemented, leaving such matters to the technical BIM specialists. In fact, the diagram violates the decision degrees rule by missing one input in both control nodes.
Tolerances
When translating tasks into information, we must often consider the tolerances for each input or output. Care should be taken that these are kept as narrow as possible. Wide tolerances are unacceptable as an indication of either ignorance or unwarranted uncertainty. As a result, they offer no sound basis for decision making. For example, a tight time planning compels us to pay more attention to the requirements and feasibility of each step, as well as to how dependencies between tasks are ordered in time. Reversely, vagueness about deadlines and milestones promotes procrastination and deferment of decisions, especially concerning steps about which we are less clear.
Testing information diagrams
Information diagrams should be tested from the perspective of each actor and stakeholder, in the same way as process diagrams. The only difference is that the relation of an actor or stakeholder to each node should be specified in terms of input, output and processing: if the task (the processing) should be undertaken by the particular actor, for example the design by the architect, they should verify their capacity to undertake it and help with the specification of the necessary input, e.g. a budget, a brief and a site description (including applicable building codes and planning regulations). The same holds for the output: the content, structure and timing of information produced in the task should be agreed in unambiguous terms. Specifying where this information is used and by whom should be avoided in order to prevent deterministic, reductionist adaptations (e.g. “if they need it only for this cost estimation, I don’t have to worry about aspects other than floor areas”).
Tracking the involvement of each actor and stakeholder is done in the same way as in process diagrams, with subgraphs and directed walks, and afterwards a board-game-like simulation for the whole group of actors and stakeholders. In the group simulation, it is especially important to reach general agreement about the input and output of each task, as well as about the custodianship of information: it is not enough to know who is the author of some information; who takes care of it at different stages of the process is not necessarily the same, obvious to all or automatic. In the context of BIM, moreover, a distinction should be made concerning care for the technical aspects of a model (which can be delegated to digitization specialists) and the content of symbols and relations (which remains a responsibility of process stakeholders).
Finally, once an information diagram is finalized, one should consider the semantic type of information used as input in any task: if it is derivative, it should be possible to track it back to the primary data from which it is produced. Floor areas are derivative, so we must be able to identify the primary data from which they derive in the information diagram, as well as the representations that accommodate these primary data.
Graph measures
The graph measures used to analyse process diagrams obviously also apply to information diagrams. The significance and meaning of degrees, bridges, distances, closeness, centers and peripheries are the same in both. Differences tend to be subtle and primarily reflect the shift of attention from tasks to information. For example, while a node denoting designing is central in a process diagram, it is the node of the design representation (e.g. the BIM model) that takes central position in the information diagram. Being more analytical and specific, information diagrams also have a larger size and order than their process counterparts. This makes graph drawing and legibility more difficult, and requires more careful analysis and measurement. A useful strategy is to consider each part of the process in its own subgraph, without neglecting arcs that connect nodes in different subgraphs. To make certain that no such connection is obscured, any analysis in subraphs should be followed by analysis of the whole graph. One should always keep in mind that any partial consideration of a process is simply for reasons of convenience and not subdivide the process in artificially distinct modules. If a process in truly modular, then each module should be treated as a separate process in order to verify its self-sufficiency.
Process validation
Information diagrams are more than an operational version of process diagrams. Their utility extends to the validation of process designs: it establishes whether the processes can deliver what they are expected to. When we translate each task and relation into information-processing actions, operationalization predictably stumbles upon hidden problems, making lacunae and inconsistencies obvious by the inability to obtain or produce the necessary information. For example, the calculation of the net area of a room presupposes a detailed, accurate representation that includes obstacles. Therefore, it is not attainable if the available representation is a floor plan sketch with only a rough description of the shape of the room and its dimensions. By showing exactly how each task is performed, information diagrams validate individual tasks but also address consistency and coherence more accurately than process diagrams: they show if all tasks are organized in the same way, with workable connections between them and with the expected final deliverables. In the above example, the mismatch between the net area calculation and the floor plan can indicate a premature use of a precise technique, a delay in design or a haphazard management approach resulting in more incompatibilities and disharmonies.
Validation is not merely technical; it also targets many of the cognitive issues discussed in the previous chapter. Even the best process designs remain subject to the biases that characterize Type 1 processes. It is always possible that erroneous assumptions and vague specifications have slipped in and populate the process description, unnoticed by project participants who share the same biases. The specificity of information diagrams helps make the cautions about cognitive limitations and their possible effects on process diagrams stronger and easier to identify on the basis of clear cues.
Eradication of Type 1 biases and illusions that have escaped scrutiny is founded on the cognitive decoupling supported by information diagrams. Even though the process and the information diagram appear quite similar, they are quite different in contect and abstraction level. The process diagram represents tasks in a way that is more rigorous than conventional process descriptions but essentially in similar terms. The information diagram shifts attention to the input and output of these tasks, and so forms a departure from the descriptions we usually apply to a process. Moreover, it supports Type 2 algorithmic processes by making such input and output explicit, often quantitative and unambiguously linked to actions and transactions.
The most obvious cue about biases in the process design is inability to obtain or produce the necessary information, as in the above example of a net area calculations. If the process diagram has been carefully set up, this suggests more than a local problem and should make us critical about what we think we know: illusions of knowledge may have resulted in grey areas that make connections between tasks uncertain. This combats overconfidence in the beliefs behind the process design and reveals biases in our expectations from it, so that predictable mistakes (often caused by adherence to customary or conventional procedures) can be avoided. As for unpredictable mistakes, information diagrams help reduce their error margins and anchor decisions around realistic, transparently derived values.
Many problems are caused by the substitution of a demanding task by a simpler one that does not deliver the necessary performance or output. Any instances of inappropriate substitution in the process design can be identified and removed on the basis of the following criteria:
- Precision and accuracy requirements: rather than accepting existing practices, consider what each task actually needs in order to achieve the highest possible performance. Compromises that reduce this performance may be inevitable but try to make them only when necessary.
- Information availability and processing capacity: basing a cost estimate on the floor area of a design may be acceptable when little is yet known about the design but doing so with a full simulation of the construction process at your disposal makes no sense. So, when translating a task into information instances, always consider what is already available in the process (information and processing tools), in particular with respect to the precision requirements of each task.
Any illusions of cause that may have persisted in the process diagram are generally easy to detect, as precedence in time (as in e.g. a time schedule) does not translate into connections of information output and input in the information diagram. In particular, information diagrams help identify the true causes of problems by tracking the derivation of information. For example, a mismatch between the load-bearing structure and the required span widths for rooms is not necessarily due to poor decision making concerning the load-bearing structure. It might also derive from vagueness or inconsistencies in the brief or from inappropriate cost constraints on the structure (i.e. inconsistencies between brief and budget).
Focusing on information is a good antidote to change and inattentional blindness, too: it is hard to ignore what is available, expected or required at any step in a process. This also subverts any narrow focus by being inclusive and comprehensive by necessity, while removing opportunities to add fictitious information that does not come from a specific internal or external source. The coherence and consistency that can be achieved with information diagrams is important for avoiding planning and sunken-costs fallacies: being specific on information leaves even less room for illusions of knowledge and confidence. Finally, information diagrams help develop an outside view of the project by making clear the connections between internal information to external sources, including through reference class forecasting: references to relevant classes of projects, reliable statistics on these projects and baseline forecasts from these statistics that are adapted to the characteristics of the particular case.[1] The development of reference classes may initially seem daunting but it is something any enterprise or professional body can do if projects are properly documented.
Despite its rigour, validation at the information level is less confrontational than at the process level. Challenging suspect parts in a process description with general facts, principles and opinions leads to discussions that can be dismissed merely because they conflict with basic assumptions (“we’ve always made our budgets this way”). Expressing the process in terms of information actions and transactions returns more objective, comprehensive and practical arguments why a process may or may not deliver the expected results. The discussion consequently shifts from general principles to how and which information is processed with respect to stated goals, such as delivering a building with the required qualities and performance on time and within budget.
Veracity
An important aspect of validation concerns the veracity of information. The problem is that, even without the halo effect, our natural tendency is to believe that others are telling the truth. Defaulting to truth makes sense for the economy and efficiency of communication, which would suffer if we were to test the veracity of all incoming information. We are suspicious of others only when we expect them to deceive us. Suspicion is often triggered by the demeanour of the information sender but unfortunately this is a very poor indicator. We become suspicious of nervous presenters who look away and mumble, paying too much attention to the delivery rather than the content. Suspicions about the intentions of others are much more reliable but they do not normally arise in reasonably harmonious projects. Given sufficient trust, which is reinforced by inside views, actors and stakeholders routinely default to truth, failing to detect inconsistencies that undermine the veracity of information they receive. We are alert to inconsistencies only in projects that have experienced adversities such that cast doubt on the integrity or intentions of others but by then the project may be beyond saving.
Relying on the actual content of communication is more reliable and quite accurate.[2] If information is self-contradictory or inconsistent with known facts, it is easier to evaluate it and develop controls that anticipate unexpected problems. Switching from task to information therefore facilitates the integration of veracity controls in a process, usually as preliminary evaluations of information before important decisions or actions. For example, prior to analysing construction costs we should check the veracity of information input in the estimation. This involves tracing the primary data from which this information derives, as well as checking how it is derived. If the information is derived from contradictory of irrelevant sources, e.g. from a different design or an earlier version, this can be both easily detected and directly corrected. If the derivation involves questionable procedures, e.g. measurements of a supposedly typical part of the design only, these too can be detected and adjusted.
Information diagrams in information management
An information diagram that captures both the needs of a process and the capacities of BIM can make IM clear and unambiguous to both managers and actors in the process. Information flow is explicitly depicted in the diagram, especially concerning what, who and when. Managers can use the information diagram to guide and control the process at any moment, while actors have a clear picture of the scope and significance of their actions. Addressing how questions depends on the fineness of the grain in the description of information instances: the finer it is, the more specific answers one can draw from the diagram. As such specificity affects interpretation, care should be taken to balance the two: many actors in a building project are knowledgeable professionals who may not take kindly to IM approaches that overconstrain their actions.
On the other hand, IM has to be strict about matters of authorship and custodianship because not everybody is yet accustomed to the possibilities and responsibilities of digital information processing. By linking stakeholders to information with accordingly labelled arcs in the information diagram, one can indicate responsibilities and actions throughout a process. Note that roles can be variable: an actor who authors some information in one task may become custodian of other information in another task.
Concerning information quality, the information diagram forms a usable background for pragmatic value: applying the I‑P‑O scheme at any node is a critical part of measuring it, i.e. establishing what users need to process and must produce in a task. Similarly, the information diagram is essential for the evaluation of completeness, coherence and consistency in BIM: any output from the model and especially any feedback to it is an opportunity to identify violations and conflicts that affect these aspects.
Information diagrams are also essential for our parsimonious approach to information quality. The approach focuses on primary data and their propagation; both can be traced with accuracy in the diagram, including explicit, manageable connections to derivative data. This enables managers and other project participants to know what should be preserved or prioritized. Finally, in the same manner one can identify anti-data, on the basis of expectations (e.g. knowing when information from different disciplines comes together in a process) and interpretation (e.g. that a space without a door is a shaft). This leads to directed action (e.g. requiring that two disciplines work together to solve interfacing problems), which should be present in an information diagram of appropriate specificity.
Above all, information diagrams illustrate the importance of IM for managing processes and products: information flow and quality are not technical issues but essential parts of any process, with direct relevance for specific problems and related decisions. Requiring complete, coherent, consistent and true information for a task is purely for the successful completion of the task. Any requirements on information, including syntactic ones, draw from project needs, including the drive towards avoiding cognitive biases and illusions. This confirms IM as a core part of any management approach, especially with respect to digitization and its promise for decision support.
Key Takeaways
- Information diagrams operationalize and validate process diagrams by translating them into information-processing actions and products
- The validation of process designs with information diagrams includes addressing cognitive biases and illusions
- The superimposition of the I‑P‑O scheme on process task nodes helps translate a process diagram into an information diagram
- Information diagrams should take into account the implementation environment of BIM: the symbols and relations that contain the primary data and the views that present derivative data, as well as the possibilities for quality control
Exercises
- Compare the graph measures of Figure 2 to those of Figure 3: which differences do you observe and what are their causes and significance for the process design?
- Add symbols, properties and relations to the information diagram of Figure 6 (especially with respect to feedback). Does the increased specificity make IM easier or more reliable?
- Add actors to the information diagram of Figure 6. How does the result compare to Figure 2 (also in terms of graph measures)?
- Complete Figure 7 by specifying how quality controls are performed (correct the diagram with respect to the decision degrees rule).
- Make an information diagram for Figure 6 in the previous chapter (the “more comprehensive process diagram”).
- Reference class forecasting is explained in: Flyvbjerg, B. (2011). Over Budget, Over Time, Over and Over Again: Managing Major Projects. In Morris, P.W. G; Pinto, JK; Söderlund, J. (eds.), The Oxford Handbook of Project Management. Oxford: Oxford University Press. ↵
- Levine, T. R. (2014). Truth-Default Theory (TDT): A Theory of Human Deception and Deception Detection. Journal of Language and Social Psychology, 33(4), 378–392. https://doi.org/10.1177/0261927X14535916 ↵