
19.4: Data Tools Group
- Page ID
- 13711

\( \newcommand{\vecs}[1]{\overset { \scriptstyle \rightharpoonup} {\mathbf{#1}} } \)
\( \newcommand{\vecd}[1]{\overset{-\!-\!\rightharpoonup}{\vphantom{a}\smash {#1}}} \)
\( \newcommand{\id}{\mathrm{id}}\) \( \newcommand{\Span}{\mathrm{span}}\)
( \newcommand{\kernel}{\mathrm{null}\,}\) \( \newcommand{\range}{\mathrm{range}\,}\)
\( \newcommand{\RealPart}{\mathrm{Re}}\) \( \newcommand{\ImaginaryPart}{\mathrm{Im}}\)
\( \newcommand{\Argument}{\mathrm{Arg}}\) \( \newcommand{\norm}[1]{\| #1 \|}\)
\( \newcommand{\inner}[2]{\langle #1, #2 \rangle}\)
\( \newcommand{\Span}{\mathrm{span}}\)
\( \newcommand{\id}{\mathrm{id}}\)
\( \newcommand{\Span}{\mathrm{span}}\)
\( \newcommand{\kernel}{\mathrm{null}\,}\)
\( \newcommand{\range}{\mathrm{range}\,}\)
\( \newcommand{\RealPart}{\mathrm{Re}}\)
\( \newcommand{\ImaginaryPart}{\mathrm{Im}}\)
\( \newcommand{\Argument}{\mathrm{Arg}}\)
\( \newcommand{\norm}[1]{\| #1 \|}\)
\( \newcommand{\inner}[2]{\langle #1, #2 \rangle}\)
\( \newcommand{\Span}{\mathrm{span}}\) \( \newcommand{\AA}{\unicode[.8,0]{x212B}}\)
\( \newcommand{\vectorA}[1]{\vec{#1}} % arrow\)
\( \newcommand{\vectorAt}[1]{\vec{\text{#1}}} % arrow\)
\( \newcommand{\vectorB}[1]{\overset { \scriptstyle \rightharpoonup} {\mathbf{#1}} } \)
\( \newcommand{\vectorC}[1]{\textbf{#1}} \)
\( \newcommand{\vectorD}[1]{\overrightarrow{#1}} \)
\( \newcommand{\vectorDt}[1]{\overrightarrow{\text{#1}}} \)
\( \newcommand{\vectE}[1]{\overset{-\!-\!\rightharpoonup}{\vphantom{a}\smash{\mathbf {#1}}}} \)
\( \newcommand{\vecs}[1]{\overset { \scriptstyle \rightharpoonup} {\mathbf{#1}} } \)
\( \newcommand{\vecd}[1]{\overset{-\!-\!\rightharpoonup}{\vphantom{a}\smash {#1}}} \)
\(\newcommand{\avec}{\mathbf a}\) \(\newcommand{\bvec}{\mathbf b}\) \(\newcommand{\cvec}{\mathbf c}\) \(\newcommand{\dvec}{\mathbf d}\) \(\newcommand{\dtil}{\widetilde{\mathbf d}}\) \(\newcommand{\evec}{\mathbf e}\) \(\newcommand{\fvec}{\mathbf f}\) \(\newcommand{\nvec}{\mathbf n}\) \(\newcommand{\pvec}{\mathbf p}\) \(\newcommand{\qvec}{\mathbf q}\) \(\newcommand{\svec}{\mathbf s}\) \(\newcommand{\tvec}{\mathbf t}\) \(\newcommand{\uvec}{\mathbf u}\) \(\newcommand{\vvec}{\mathbf v}\) \(\newcommand{\wvec}{\mathbf w}\) \(\newcommand{\xvec}{\mathbf x}\) \(\newcommand{\yvec}{\mathbf y}\) \(\newcommand{\zvec}{\mathbf z}\) \(\newcommand{\rvec}{\mathbf r}\) \(\newcommand{\mvec}{\mathbf m}\) \(\newcommand{\zerovec}{\mathbf 0}\) \(\newcommand{\onevec}{\mathbf 1}\) \(\newcommand{\real}{\mathbb R}\) \(\newcommand{\twovec}[2]{\left[\begin{array}{r}#1 \\ #2 \end{array}\right]}\) \(\newcommand{\ctwovec}[2]{\left[\begin{array}{c}#1 \\ #2 \end{array}\right]}\) \(\newcommand{\threevec}[3]{\left[\begin{array}{r}#1 \\ #2 \\ #3 \end{array}\right]}\) \(\newcommand{\cthreevec}[3]{\left[\begin{array}{c}#1 \\ #2 \\ #3 \end{array}\right]}\) \(\newcommand{\fourvec}[4]{\left[\begin{array}{r}#1 \\ #2 \\ #3 \\ #4 \end{array}\right]}\) \(\newcommand{\cfourvec}[4]{\left[\begin{array}{c}#1 \\ #2 \\ #3 \\ #4 \end{array}\right]}\) \(\newcommand{\fivevec}[5]{\left[\begin{array}{r}#1 \\ #2 \\ #3 \\ #4 \\ #5 \\ \end{array}\right]}\) \(\newcommand{\cfivevec}[5]{\left[\begin{array}{c}#1 \\ #2 \\ #3 \\ #4 \\ #5 \\ \end{array}\right]}\) \(\newcommand{\mattwo}[4]{\left[\begin{array}{rr}#1 \amp #2 \\ #3 \amp #4 \\ \end{array}\right]}\) \(\newcommand{\laspan}[1]{\text{Span}\{#1\}}\) \(\newcommand{\bcal}{\cal B}\) \(\newcommand{\ccal}{\cal C}\) \(\newcommand{\scal}{\cal S}\) \(\newcommand{\wcal}{\cal W}\) \(\newcommand{\ecal}{\cal E}\) \(\newcommand{\coords}[2]{\left\{#1\right\}_{#2}}\) \(\newcommand{\gray}[1]{\color{gray}{#1}}\) \(\newcommand{\lgray}[1]{\color{lightgray}{#1}}\) \(\newcommand{\rank}{\operatorname{rank}}\) \(\newcommand{\row}{\text{Row}}\) \(\newcommand{\col}{\text{Col}}\) \(\renewcommand{\row}{\text{Row}}\) \(\newcommand{\nul}{\text{Nul}}\) \(\newcommand{\var}{\text{Var}}\) \(\newcommand{\corr}{\text{corr}}\) \(\newcommand{\len}[1]{\left|#1\right|}\) \(\newcommand{\bbar}{\overline{\bvec}}\) \(\newcommand{\bhat}{\widehat{\bvec}}\) \(\newcommand{\bperp}{\bvec^\perp}\) \(\newcommand{\xhat}{\widehat{\xvec}}\) \(\newcommand{\vhat}{\widehat{\vvec}}\) \(\newcommand{\uhat}{\widehat{\uvec}}\) \(\newcommand{\what}{\widehat{\wvec}}\) \(\newcommand{\Sighat}{\widehat{\Sigma}}\) \(\newcommand{\lt}{<}\) \(\newcommand{\gt}{>}\) \(\newcommand{\amp}{&}\) \(\definecolor{fillinmathshade}{gray}{0.9}\)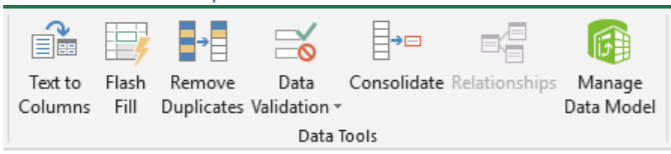
The Data Tools group provides some powerful commands that allow a user to manipulate their data. Imagine you have imported a set of data from a web-based program that contains customer addresses interested in a particular product. You would like to use the data to send out brochures with coupons to them about products they could buy. However, the data you received from your database contained all of the information in one cell per row.
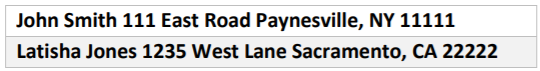
Your mail merge program cannot print address labels for data in this format, as you require separate information in particular cells for first & last name, address, city, state, and zip code. Using the data tools group, you can manipulate the data to get the data into the required format.
Converting Text to Columns
By selecting Text to Columns  icon, a Convert Text to Columns Wizard launches, allowing the user to determine how to separate the text into multiple columns.
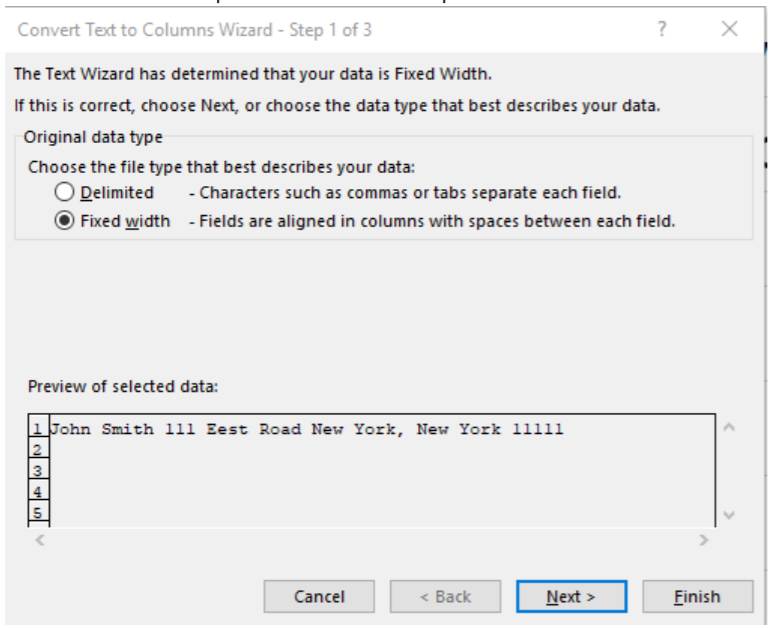
The Delimited option allows the user to instruct Excel to separate text based upon a character in the text, while Fixed Width allows for the columns to be separated by their width. Usually, Delimited is the most useful option, but Fixed Width can be used if all of the data contain data sets that can be separated at the same measurements. For the purposes of this illustration, we will use Delimited. After selecting Delimited and clicking Next, Step 2 of the Wizard is available.
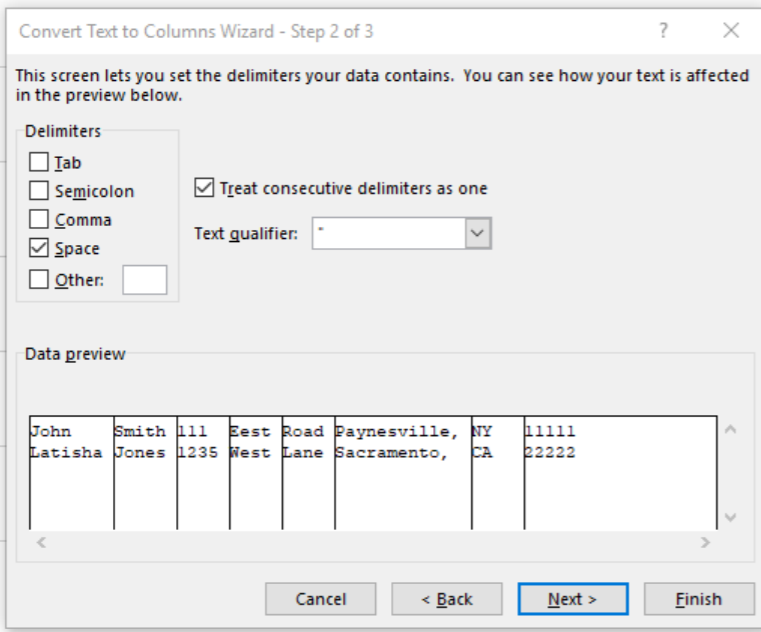
Now, the user can decide the specific type of Delimiter Excel can use to move the text into the next column. I have chosen the Space Delimiter (though I could also create a custom delimiter). A preview of the data is provided below. Selecting Next, the wizard will launch the final step of the wizard by allowing the user to determine which columns are to be included in the Wizard and the type of data in the cells and the location where the cells should be entered. The default is to begin in the same column as the original.
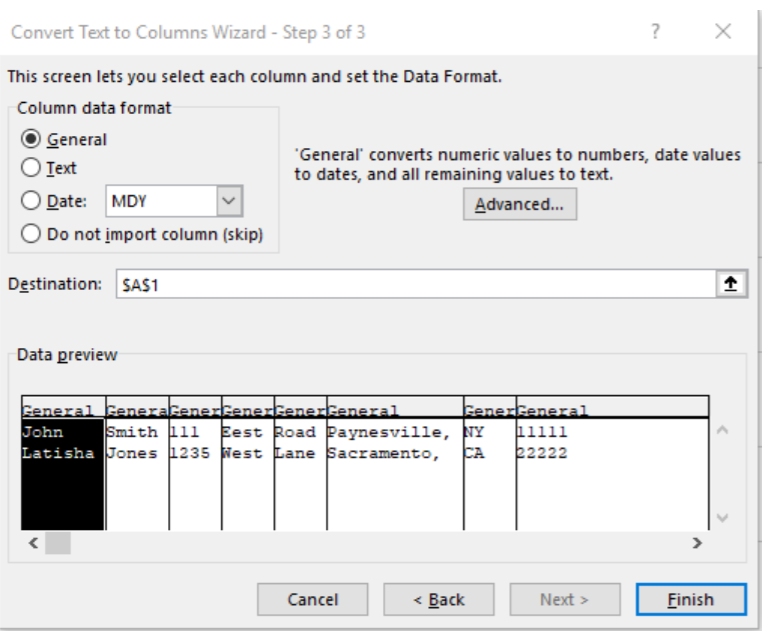
Finally, the user can select Finish to complete the Wizard. Now displayed is the information completely separated by spaces.

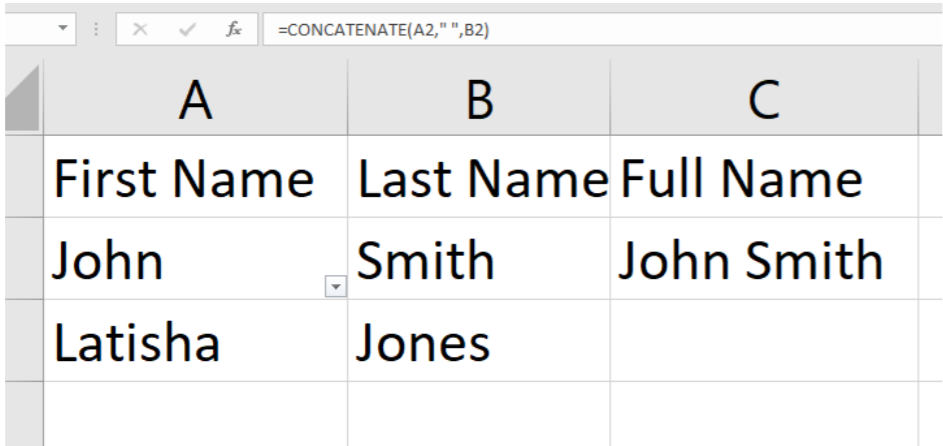
While the Excel function has correctly completed the task, the fields still are not in the correct format, because certain fields are supposed to be together. As a reminder, cells should contain the first & last name, address, city, state, and zip code. Now, we must use formulas in Excel to merge the data as needed. We can use the Concatenate Formula in a newly created Column we will name Full Name to combine the First and Last Name Fields. We add the formula “=CONCATENATE(A2," ", B2)” into the Full Name cell with the “ “ added so Excel places a space between the first and last name. After executing the formula, the First and Last Names are merged.
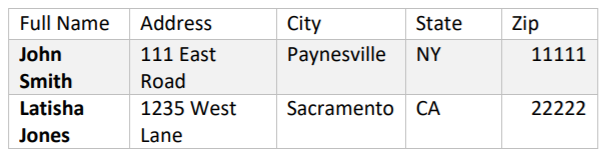
Now, we can add this formula to merge the other applicable cells, and hide the cells with information that is unnecessary. Now, we have the following table:
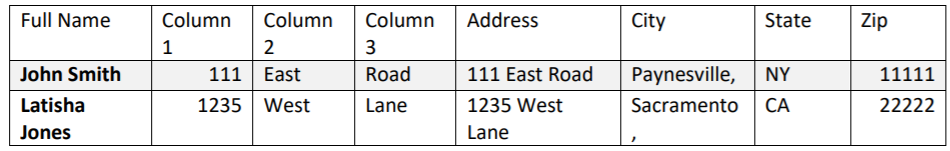
We are almost completed, but we must first remove the comma “,” that is in the City field. To do so, we will use the Replace feature of Excel. We wish to find all commas and replace them with a space.
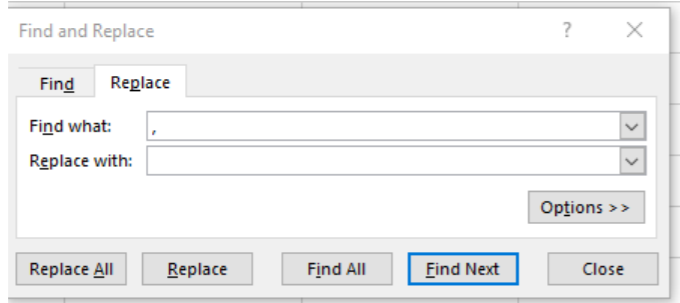
Finally, now our data is accurate.
Remove Duplicates
The Remove Duplicates  feature in the Data Tools group is also very helpful when working with a large set of data. To continue the example, let us imagine that we downloaded a large set of data that contained the names of every customer who had expressed interest in a product. So as not to waste resources or mail individuals twice, you decide you want to remove duplicates. Usually, the data set can be too large to accomplish this. However, using the Remove Duplicates feature, it is not.
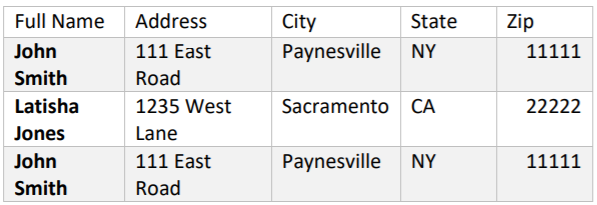
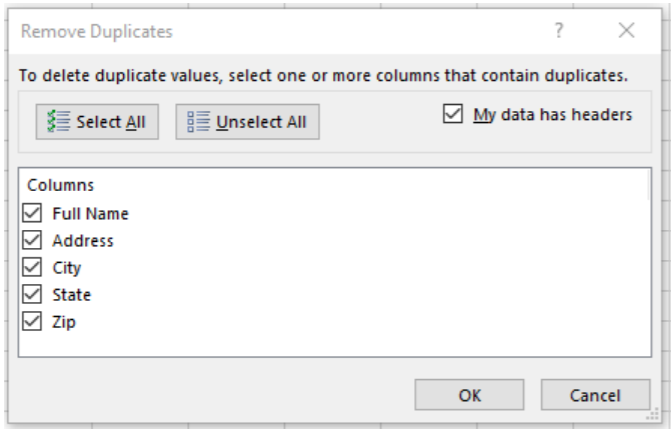
With a cell selected in your table, selecting the Remove Duplicates icon will launch the Remove Duplicates wizard. The wizard will ask the user to determine which columns should be evaluated for duplicates. I will select the full name column.
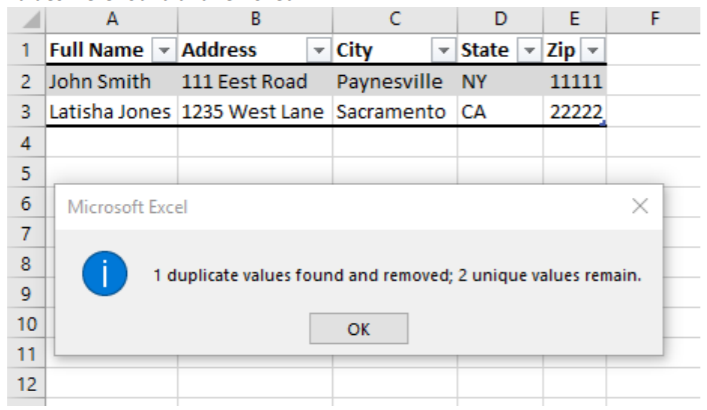
After clicking OK, Excel removes the duplicate row information and informs the user that 1 duplicate values were found and removed.
Data Validation Tool
Excel’s Data Validation Tool  allows the user to specify which kinds of information can be inserted into a cell. The user can require only specified text, or limit a text field to numbers only. Selecting the Data Validation icon will launch a Data Validation wizard
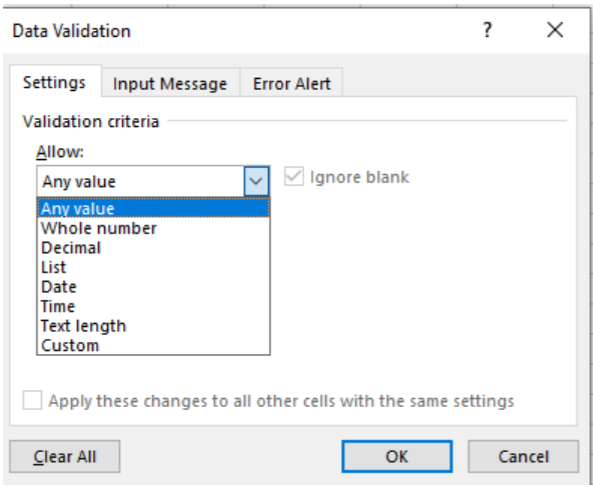
Using the wizard, users can determine program excel to require a whole number, or decimal, or a list of options (that you provide from a range of cells in the workbook), date, time, a limit for text, and any other custom options. Users can also program the cells to display a message with instructions for the user.
Consolidate, Relationships, and Manage Data Model & Forecast Group
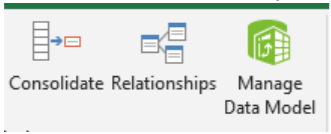
(Retrieved from Office.com Help). Users can select the Consolidate Icon to summarize and report results from separate worksheets, you can consolidate data from each sheet into a master worksheet. The sheets can be in the same workbook as the master worksheet, or in other workbooks. When you consolidate data, you assemble data so that you can more easily update and aggregate as necessary.
For example, if you have an expense worksheet for each of your regional offices, you might use consolidation to roll these figures into a master corporate expense worksheet. This master worksheet might also contain sales totals and averages, current inventory levels, and the highest-selling products for the entire enterprise.
The Relationships & Manage Data Model icons allow the user to create relationships between different tables and workbooks of data. This might allow data to be matched between tables, or to connect the tables for more batch processing. As this is not a Beginner to Intermediate class, Relationships and Manage Data Model will not be addressed in depth.
The Forecast Group  is made to make projections based upon different variables in formulas and create forecasts. This information is also saved for an advanced class.
Outline Group
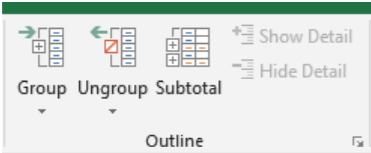
Perhaps you are working with large sets of data that contain information that you want to keep together or organize. The Outline Group has a variety of tools that allow the user to group, ungroup, or subtotal sets of data together. Reviewing the data previously used an example, perhaps you would like to group this data because each of these customers requested information on the same day. To do so, highlight the cells to be included in a group, and select the Group icon in the ribbon. The user is provided with the choice to group either rows or columns (we select rows) and the cells are grouped.
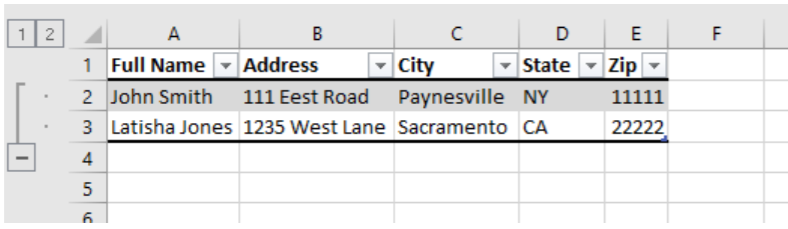
line to the left of the row headings is set to indicate the rows are together. The user can simply click the Ungroup icon to remove these from a group. The subtotal icon quickly and compute rows of numerical data to calculate a subtotal. The Show and Hide Detail icons collapse and hide the group.