9.1: Big Picture- Industry Analysis
- Page ID
- 4468
\( \newcommand{\vecs}[1]{\overset { \scriptstyle \rightharpoonup} {\mathbf{#1}} } \)
\( \newcommand{\vecd}[1]{\overset{-\!-\!\rightharpoonup}{\vphantom{a}\smash {#1}}} \)
\( \newcommand{\id}{\mathrm{id}}\) \( \newcommand{\Span}{\mathrm{span}}\)
( \newcommand{\kernel}{\mathrm{null}\,}\) \( \newcommand{\range}{\mathrm{range}\,}\)
\( \newcommand{\RealPart}{\mathrm{Re}}\) \( \newcommand{\ImaginaryPart}{\mathrm{Im}}\)
\( \newcommand{\Argument}{\mathrm{Arg}}\) \( \newcommand{\norm}[1]{\| #1 \|}\)
\( \newcommand{\inner}[2]{\langle #1, #2 \rangle}\)
\( \newcommand{\Span}{\mathrm{span}}\)
\( \newcommand{\id}{\mathrm{id}}\)
\( \newcommand{\Span}{\mathrm{span}}\)
\( \newcommand{\kernel}{\mathrm{null}\,}\)
\( \newcommand{\range}{\mathrm{range}\,}\)
\( \newcommand{\RealPart}{\mathrm{Re}}\)
\( \newcommand{\ImaginaryPart}{\mathrm{Im}}\)
\( \newcommand{\Argument}{\mathrm{Arg}}\)
\( \newcommand{\norm}[1]{\| #1 \|}\)
\( \newcommand{\inner}[2]{\langle #1, #2 \rangle}\)
\( \newcommand{\Span}{\mathrm{span}}\) \( \newcommand{\AA}{\unicode[.8,0]{x212B}}\)
\( \newcommand{\vectorA}[1]{\vec{#1}} % arrow\)
\( \newcommand{\vectorAt}[1]{\vec{\text{#1}}} % arrow\)
\( \newcommand{\vectorB}[1]{\overset { \scriptstyle \rightharpoonup} {\mathbf{#1}} } \)
\( \newcommand{\vectorC}[1]{\textbf{#1}} \)
\( \newcommand{\vectorD}[1]{\overrightarrow{#1}} \)
\( \newcommand{\vectorDt}[1]{\overrightarrow{\text{#1}}} \)
\( \newcommand{\vectE}[1]{\overset{-\!-\!\rightharpoonup}{\vphantom{a}\smash{\mathbf {#1}}}} \)
\( \newcommand{\vecs}[1]{\overset { \scriptstyle \rightharpoonup} {\mathbf{#1}} } \)
\( \newcommand{\vecd}[1]{\overset{-\!-\!\rightharpoonup}{\vphantom{a}\smash {#1}}} \)
\(\newcommand{\avec}{\mathbf a}\) \(\newcommand{\bvec}{\mathbf b}\) \(\newcommand{\cvec}{\mathbf c}\) \(\newcommand{\dvec}{\mathbf d}\) \(\newcommand{\dtil}{\widetilde{\mathbf d}}\) \(\newcommand{\evec}{\mathbf e}\) \(\newcommand{\fvec}{\mathbf f}\) \(\newcommand{\nvec}{\mathbf n}\) \(\newcommand{\pvec}{\mathbf p}\) \(\newcommand{\qvec}{\mathbf q}\) \(\newcommand{\svec}{\mathbf s}\) \(\newcommand{\tvec}{\mathbf t}\) \(\newcommand{\uvec}{\mathbf u}\) \(\newcommand{\vvec}{\mathbf v}\) \(\newcommand{\wvec}{\mathbf w}\) \(\newcommand{\xvec}{\mathbf x}\) \(\newcommand{\yvec}{\mathbf y}\) \(\newcommand{\zvec}{\mathbf z}\) \(\newcommand{\rvec}{\mathbf r}\) \(\newcommand{\mvec}{\mathbf m}\) \(\newcommand{\zerovec}{\mathbf 0}\) \(\newcommand{\onevec}{\mathbf 1}\) \(\newcommand{\real}{\mathbb R}\) \(\newcommand{\twovec}[2]{\left[\begin{array}{r}#1 \\ #2 \end{array}\right]}\) \(\newcommand{\ctwovec}[2]{\left[\begin{array}{c}#1 \\ #2 \end{array}\right]}\) \(\newcommand{\threevec}[3]{\left[\begin{array}{r}#1 \\ #2 \\ #3 \end{array}\right]}\) \(\newcommand{\cthreevec}[3]{\left[\begin{array}{c}#1 \\ #2 \\ #3 \end{array}\right]}\) \(\newcommand{\fourvec}[4]{\left[\begin{array}{r}#1 \\ #2 \\ #3 \\ #4 \end{array}\right]}\) \(\newcommand{\cfourvec}[4]{\left[\begin{array}{c}#1 \\ #2 \\ #3 \\ #4 \end{array}\right]}\) \(\newcommand{\fivevec}[5]{\left[\begin{array}{r}#1 \\ #2 \\ #3 \\ #4 \\ #5 \\ \end{array}\right]}\) \(\newcommand{\cfivevec}[5]{\left[\begin{array}{c}#1 \\ #2 \\ #3 \\ #4 \\ #5 \\ \end{array}\right]}\) \(\newcommand{\mattwo}[4]{\left[\begin{array}{rr}#1 \amp #2 \\ #3 \amp #4 \\ \end{array}\right]}\) \(\newcommand{\laspan}[1]{\text{Span}\{#1\}}\) \(\newcommand{\bcal}{\cal B}\) \(\newcommand{\ccal}{\cal C}\) \(\newcommand{\scal}{\cal S}\) \(\newcommand{\wcal}{\cal W}\) \(\newcommand{\ecal}{\cal E}\) \(\newcommand{\coords}[2]{\left\{#1\right\}_{#2}}\) \(\newcommand{\gray}[1]{\color{gray}{#1}}\) \(\newcommand{\lgray}[1]{\color{lightgray}{#1}}\) \(\newcommand{\rank}{\operatorname{rank}}\) \(\newcommand{\row}{\text{Row}}\) \(\newcommand{\col}{\text{Col}}\) \(\renewcommand{\row}{\text{Row}}\) \(\newcommand{\nul}{\text{Nul}}\) \(\newcommand{\var}{\text{Var}}\) \(\newcommand{\corr}{\text{corr}}\) \(\newcommand{\len}[1]{\left|#1\right|}\) \(\newcommand{\bbar}{\overline{\bvec}}\) \(\newcommand{\bhat}{\widehat{\bvec}}\) \(\newcommand{\bperp}{\bvec^\perp}\) \(\newcommand{\xhat}{\widehat{\xvec}}\) \(\newcommand{\vhat}{\widehat{\vvec}}\) \(\newcommand{\uhat}{\widehat{\uvec}}\) \(\newcommand{\what}{\widehat{\wvec}}\) \(\newcommand{\Sighat}{\widehat{\Sigma}}\) \(\newcommand{\lt}{<}\) \(\newcommand{\gt}{>}\) \(\newcommand{\amp}{&}\) \(\definecolor{fillinmathshade}{gray}{0.9}\)Learning Objectives
- Distinguish between an industry and company analysis
- Analyze an industry using S.W.O.T. and Porter’s five forces model
Introduction
Before launching a business venture with your capital, or someone else’s, it is a good idea to analyze the overall attractiveness of the industry. An industry analysis makes no reference to your particular company. In other words, how likely to succeed would any new company be in this industry? Are there parts of the industry that are more attractive than others?
Loan officers or investors especially, are going to want to see an analysis of the industry. One thing they will look for is growth potential. If you can show that the industry is rapidly growing, you may get funding. From an investor’s point of view, they might simply want to have a dog in the race—even if your company is not necessarily the best dog overall—it may still be the best dog on hand.
One can establish growth potential by showing trends over time. For apps this would include showing growth in sales of apps and the platforms on which the apps run—iPhone, iPod, iPad.
If your app duplicates functionality found in another device, a turn by turn GPS for example, then you could show growth in the GPS industry. You might also want to show growth of competing platforms and apps such as the Droid. However, you should be honest and straightforward about your statistics. Investors are smart and can see through hype and deception.
This chapter will also look at two tools used to perform industry analyses—S.W.O.T. and Michael Porter’s five forces model.
Where Are We in the Life Cycle?
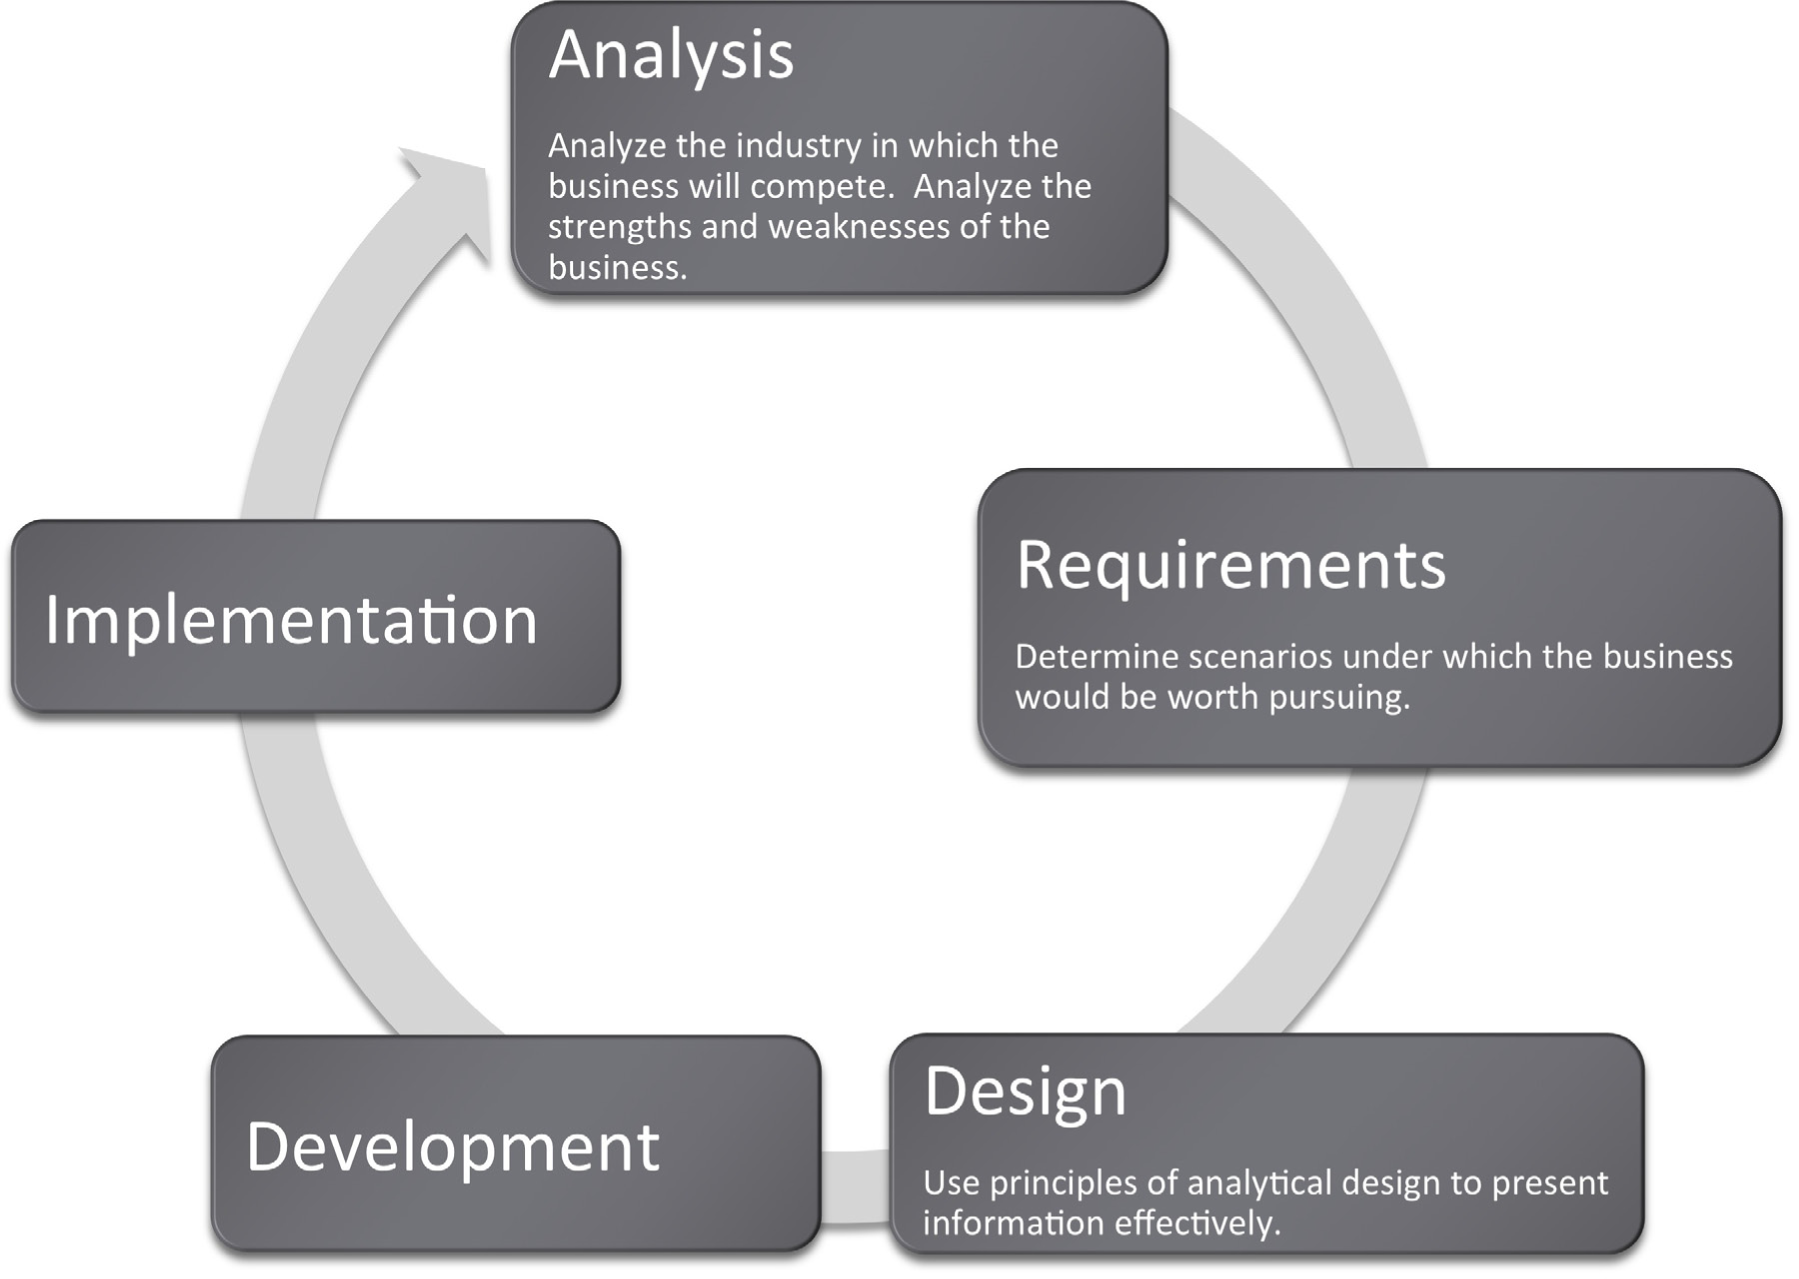
Many information systems projects are conceived of in a life cycle that progresses in stages from analysis to implementation. The diagram below shows the stages that we touch in the current chapter:

Industry Analysis - SWOT and Porter’s
The content of an industry analysis depends on the purpose of the report. There is no one size fits all. However, if the business is seeking funds, investors will at a minimum want to see two things:
- Industry analysis: An analysis of the industry in which the company operates. What are the opportunities and threats inherent in the industry?
- Company analysis: An analysis of the competitive position of the company within that industry. What are the strengths and weaknesses of the company?
There are a number of analysis techniques designed to get at both the industry and company analysis. We will look at just two:
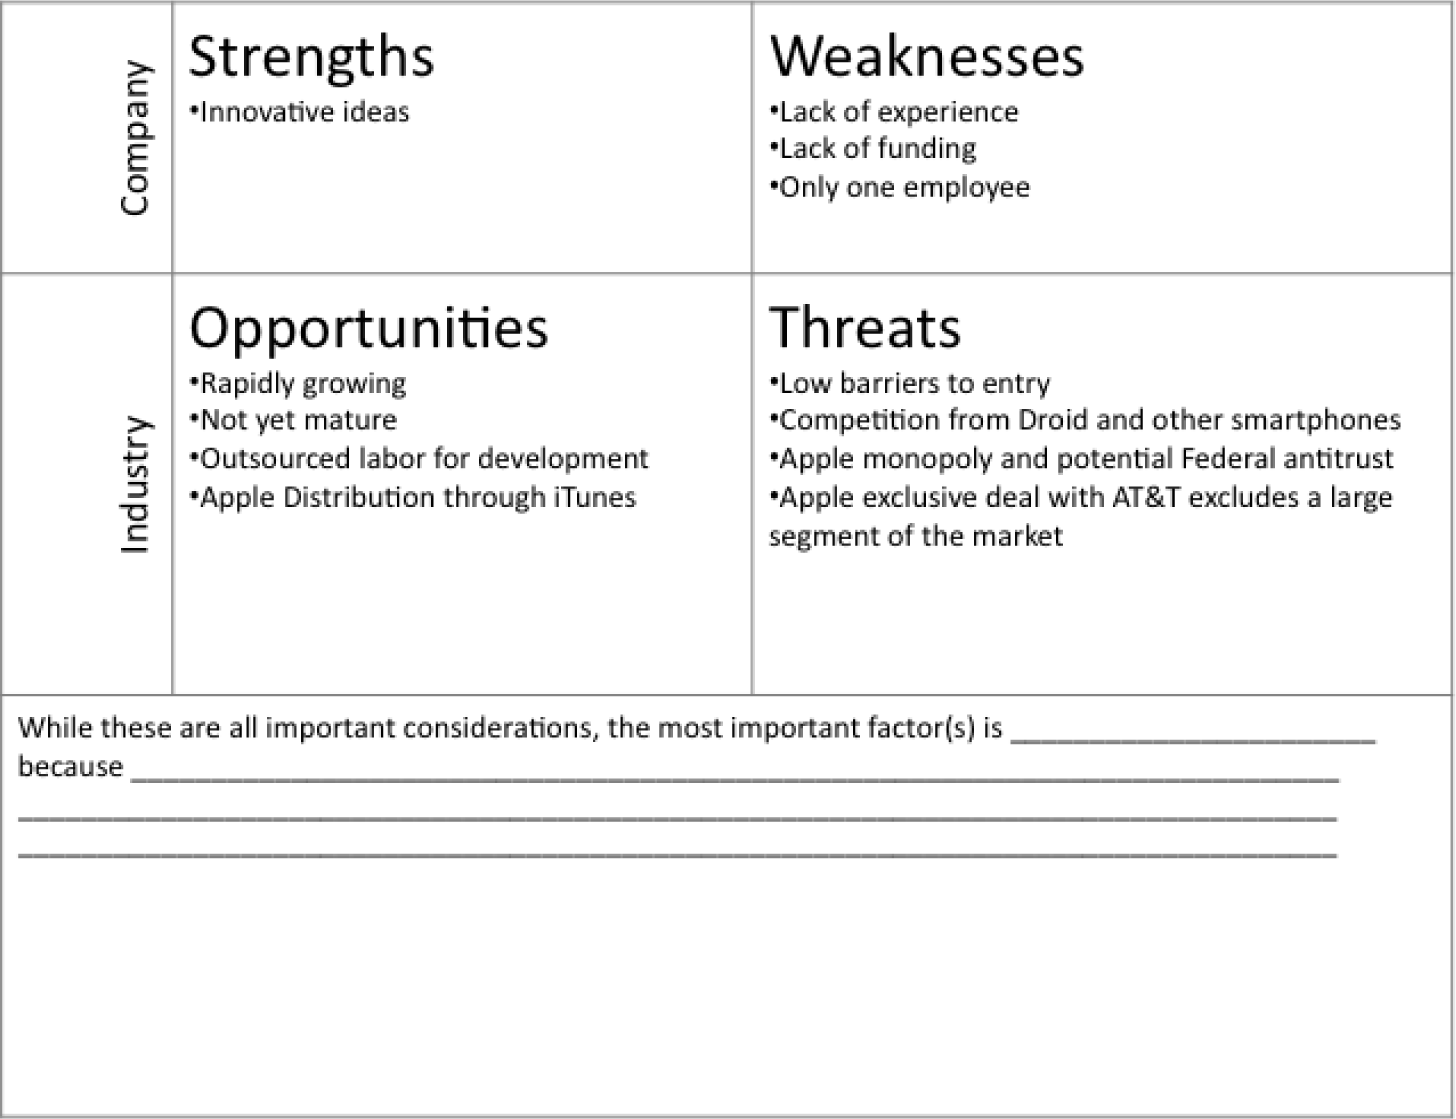
The first is very popular in the marketing discipline. It is an analysis of strengths, weaknesses, opportunities, and threats (S.W.O.T.) analysis developed by Albert Humphrey in the 1960s. The strengths and weaknesses compose the company analysis, whereas opportunities and threats compose the industry analysis. Using terms from the SDLC, you can consider the strengths and weaknesses as describing the current state of the company. The proposed future state of the company will be planned taking into account the opportunities and threats. It is conventional to show a S.W.O.T. analysis in a four cell grid.
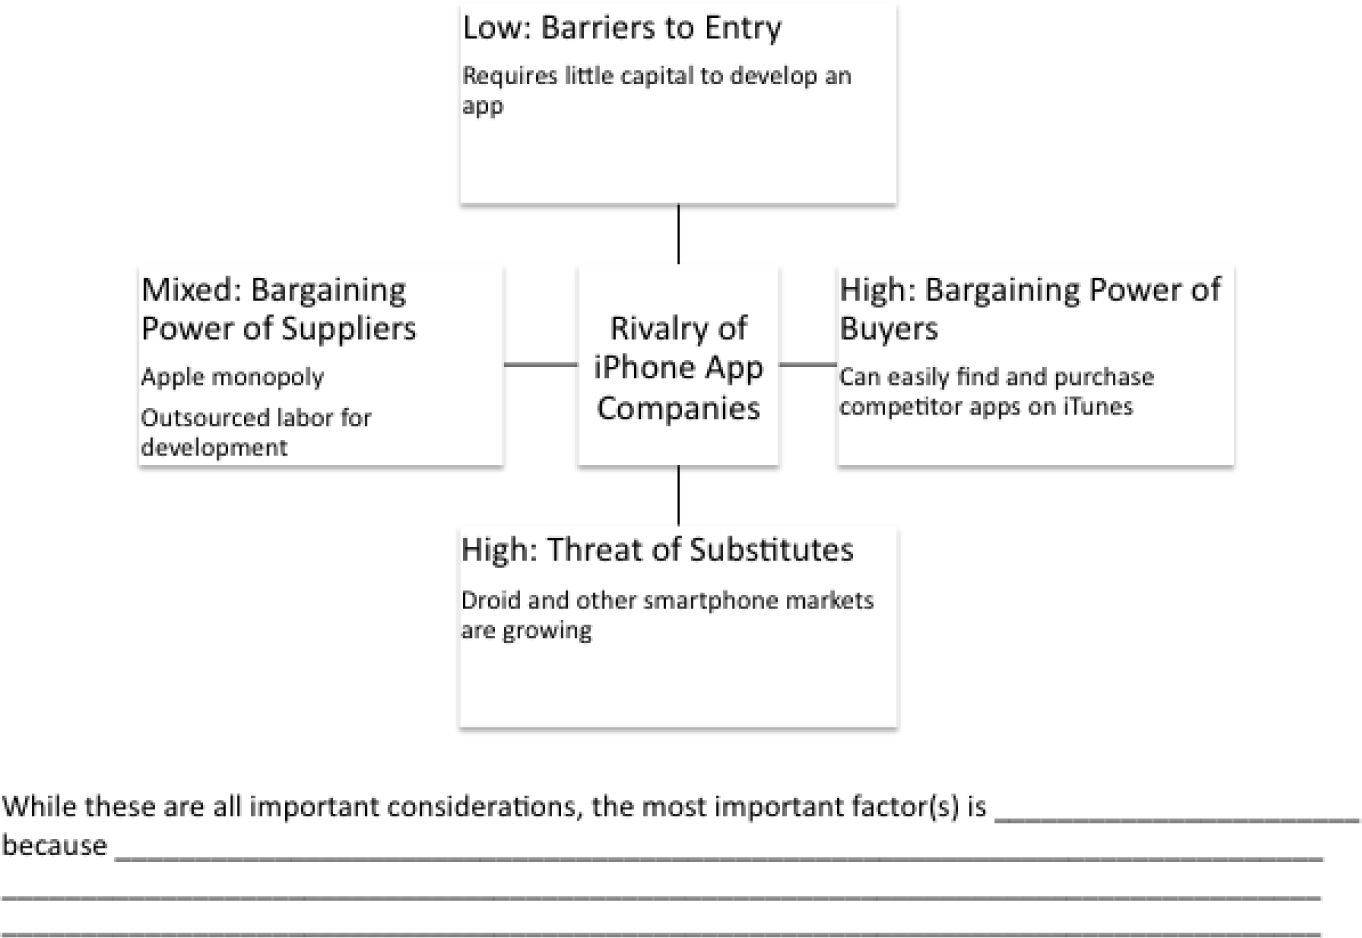
Another very popular analysis tool is Michael Porter’s five forces model. (Porter, M.E. (2008) The Five Competitive Forces That Shape Strategy, Harvard business Review, January 2008). Porter analyzes an industry by looking at how hard it is to get in the industry (barriers to entry), stay in the industry (threat of substitutes), and the bargaining position of suppliers to and buyers of industry products and services. This helps identify the attractiveness of the industry. You might think of Porter as helping to direct our focus to where the opportunities and threats might be found. The fifth force is the competitive position of industry rivals—their strengths and weaknesses.

An analysis of the iPhone app industry using S.W.O.T. analysis (above) and Porter’s five forces model (below). Both models overlap in their analyses.

For example, with respect to your iPhone app, you might argue that barriers to entry are very low. There are thousands of iPhone developers and it cost relatively little to develop an iPhone app. The threat of substitutes includes the competing Droid and other smart phones and apps.
Suppliers to your industry include Apple, which supplies the iTunes store for distribution and the developers. Apple’s bargaining power is very high since you must list your app on their store and pay their commission. However, the bargaining power of developers is relatively low since they compete in an open auction for your business.
The bargaining power of buyers is very strong since they can purchase from you or any of your competitors. The only thing that makes this industry attractive is that it is growing at such a phenomenal rate that there are business opportunities even for weak players. As the industry matures, the weaker players will probably get squeezed out.
Key Takeaways
- Investors will want to see an analysis of the industry and an analysis of your company’s competitive position in the industry.
- S.W.O.T. and Porter’s five forces assist with industry analysis. S.W.O.T. also helps with the company analysis.
Questions and Exercises
- Why would an investor need both an industry and company analysis? Explain.


