
4: Data and Databases
- Page ID
- 4311

\( \newcommand{\vecs}[1]{\overset { \scriptstyle \rightharpoonup} {\mathbf{#1}} } \)
\( \newcommand{\vecd}[1]{\overset{-\!-\!\rightharpoonup}{\vphantom{a}\smash {#1}}} \)
\( \newcommand{\dsum}{\displaystyle\sum\limits} \)
\( \newcommand{\dint}{\displaystyle\int\limits} \)
\( \newcommand{\dlim}{\displaystyle\lim\limits} \)
\( \newcommand{\id}{\mathrm{id}}\) \( \newcommand{\Span}{\mathrm{span}}\)
( \newcommand{\kernel}{\mathrm{null}\,}\) \( \newcommand{\range}{\mathrm{range}\,}\)
\( \newcommand{\RealPart}{\mathrm{Re}}\) \( \newcommand{\ImaginaryPart}{\mathrm{Im}}\)
\( \newcommand{\Argument}{\mathrm{Arg}}\) \( \newcommand{\norm}[1]{\| #1 \|}\)
\( \newcommand{\inner}[2]{\langle #1, #2 \rangle}\)
\( \newcommand{\Span}{\mathrm{span}}\)
\( \newcommand{\id}{\mathrm{id}}\)
\( \newcommand{\Span}{\mathrm{span}}\)
\( \newcommand{\kernel}{\mathrm{null}\,}\)
\( \newcommand{\range}{\mathrm{range}\,}\)
\( \newcommand{\RealPart}{\mathrm{Re}}\)
\( \newcommand{\ImaginaryPart}{\mathrm{Im}}\)
\( \newcommand{\Argument}{\mathrm{Arg}}\)
\( \newcommand{\norm}[1]{\| #1 \|}\)
\( \newcommand{\inner}[2]{\langle #1, #2 \rangle}\)
\( \newcommand{\Span}{\mathrm{span}}\) \( \newcommand{\AA}{\unicode[.8,0]{x212B}}\)
\( \newcommand{\vectorA}[1]{\vec{#1}} % arrow\)
\( \newcommand{\vectorAt}[1]{\vec{\text{#1}}} % arrow\)
\( \newcommand{\vectorB}[1]{\overset { \scriptstyle \rightharpoonup} {\mathbf{#1}} } \)
\( \newcommand{\vectorC}[1]{\textbf{#1}} \)
\( \newcommand{\vectorD}[1]{\overrightarrow{#1}} \)
\( \newcommand{\vectorDt}[1]{\overrightarrow{\text{#1}}} \)
\( \newcommand{\vectE}[1]{\overset{-\!-\!\rightharpoonup}{\vphantom{a}\smash{\mathbf {#1}}}} \)
\( \newcommand{\vecs}[1]{\overset { \scriptstyle \rightharpoonup} {\mathbf{#1}} } \)
\(\newcommand{\longvect}{\overrightarrow}\)
\( \newcommand{\vecd}[1]{\overset{-\!-\!\rightharpoonup}{\vphantom{a}\smash {#1}}} \)
\(\newcommand{\avec}{\mathbf a}\) \(\newcommand{\bvec}{\mathbf b}\) \(\newcommand{\cvec}{\mathbf c}\) \(\newcommand{\dvec}{\mathbf d}\) \(\newcommand{\dtil}{\widetilde{\mathbf d}}\) \(\newcommand{\evec}{\mathbf e}\) \(\newcommand{\fvec}{\mathbf f}\) \(\newcommand{\nvec}{\mathbf n}\) \(\newcommand{\pvec}{\mathbf p}\) \(\newcommand{\qvec}{\mathbf q}\) \(\newcommand{\svec}{\mathbf s}\) \(\newcommand{\tvec}{\mathbf t}\) \(\newcommand{\uvec}{\mathbf u}\) \(\newcommand{\vvec}{\mathbf v}\) \(\newcommand{\wvec}{\mathbf w}\) \(\newcommand{\xvec}{\mathbf x}\) \(\newcommand{\yvec}{\mathbf y}\) \(\newcommand{\zvec}{\mathbf z}\) \(\newcommand{\rvec}{\mathbf r}\) \(\newcommand{\mvec}{\mathbf m}\) \(\newcommand{\zerovec}{\mathbf 0}\) \(\newcommand{\onevec}{\mathbf 1}\) \(\newcommand{\real}{\mathbb R}\) \(\newcommand{\twovec}[2]{\left[\begin{array}{r}#1 \\ #2 \end{array}\right]}\) \(\newcommand{\ctwovec}[2]{\left[\begin{array}{c}#1 \\ #2 \end{array}\right]}\) \(\newcommand{\threevec}[3]{\left[\begin{array}{r}#1 \\ #2 \\ #3 \end{array}\right]}\) \(\newcommand{\cthreevec}[3]{\left[\begin{array}{c}#1 \\ #2 \\ #3 \end{array}\right]}\) \(\newcommand{\fourvec}[4]{\left[\begin{array}{r}#1 \\ #2 \\ #3 \\ #4 \end{array}\right]}\) \(\newcommand{\cfourvec}[4]{\left[\begin{array}{c}#1 \\ #2 \\ #3 \\ #4 \end{array}\right]}\) \(\newcommand{\fivevec}[5]{\left[\begin{array}{r}#1 \\ #2 \\ #3 \\ #4 \\ #5 \\ \end{array}\right]}\) \(\newcommand{\cfivevec}[5]{\left[\begin{array}{c}#1 \\ #2 \\ #3 \\ #4 \\ #5 \\ \end{array}\right]}\) \(\newcommand{\mattwo}[4]{\left[\begin{array}{rr}#1 \amp #2 \\ #3 \amp #4 \\ \end{array}\right]}\) \(\newcommand{\laspan}[1]{\text{Span}\{#1\}}\) \(\newcommand{\bcal}{\cal B}\) \(\newcommand{\ccal}{\cal C}\) \(\newcommand{\scal}{\cal S}\) \(\newcommand{\wcal}{\cal W}\) \(\newcommand{\ecal}{\cal E}\) \(\newcommand{\coords}[2]{\left\{#1\right\}_{#2}}\) \(\newcommand{\gray}[1]{\color{gray}{#1}}\) \(\newcommand{\lgray}[1]{\color{lightgray}{#1}}\) \(\newcommand{\rank}{\operatorname{rank}}\) \(\newcommand{\row}{\text{Row}}\) \(\newcommand{\col}{\text{Col}}\) \(\renewcommand{\row}{\text{Row}}\) \(\newcommand{\nul}{\text{Nul}}\) \(\newcommand{\var}{\text{Var}}\) \(\newcommand{\corr}{\text{corr}}\) \(\newcommand{\len}[1]{\left|#1\right|}\) \(\newcommand{\bbar}{\overline{\bvec}}\) \(\newcommand{\bhat}{\widehat{\bvec}}\) \(\newcommand{\bperp}{\bvec^\perp}\) \(\newcommand{\xhat}{\widehat{\xvec}}\) \(\newcommand{\vhat}{\widehat{\vvec}}\) \(\newcommand{\uhat}{\widehat{\uvec}}\) \(\newcommand{\what}{\widehat{\wvec}}\) \(\newcommand{\Sighat}{\widehat{\Sigma}}\) \(\newcommand{\lt}{<}\) \(\newcommand{\gt}{>}\) \(\newcommand{\amp}{&}\) \(\definecolor{fillinmathshade}{gray}{0.9}\)Learning Objectives
Upon successful completion of this chapter, you will be able to:
- Describe the differences between data, information, and knowledge;
- Describe why database technology must be used for data resource management;
- Define the term database and identify the steps to creating one;
- Describe the role of a database management system;
- Describe the characteristics of a data warehouse; and
- Define data mining and describe its role in an organization.
Introduction
You have already been introduced to the first two components of information systems: hardware and software. However, those two components by themselves do not make a computer useful. Imagine if you turned on a computer, started the word processor, but could not save a document. Imagine if you opened a music player but there was no music to play. Imagine opening a web browser but there were no web pages. Without data, hardware and software are not very useful! Data is the third component of an information system.
Data, Information, and Knowledge
There have been many definitions and theories about data, information, and knowledge. The three terms are often used interchangeably, although they are distinct in nature. We define and illustrate the three terms from the perspective of information systems.
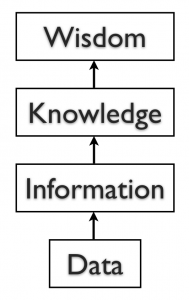 Data are the raw facts, and may be devoid of context or intent. For example, a sales order of computers is a piece of data. Data can be quantitative or qualitative. Quantitative data is numeric, the result of a measurement, count, or some other mathematical calculation. Qualitative data is descriptive. “Ruby Red,” the color of a 2013 Ford Focus, is an example of qualitative data. A number can be qualitative too: if I tell you my favorite number is 5, that is qualitative data because it is descriptive, not the result of a measurement or mathematical calculation.
Information is processed data that possess context, relevance, and purpose. For example, monthly sales calculated from the collected daily sales data for the past year are information. Information typically involves the manipulation of raw data to obtain an indication of magnitude, trends, in patterns in the data for a purpose.
Knowledge in a certain area is human beliefs or perceptions about relationships among facts or concepts relevant to that area. For example, the conceived relationship between the quality of goods and the sales is knowledge. Knowledge can be viewed as information that facilitates action.
Once we have put our data into context, aggregated and analyzed it, we can use it to make decisions for our organization. We can say that this consumption of information produces knowledge. This knowledge can be used to make decisions, set policies, and even spark innovation.
Explicit knowledge typically refers to knowledge that can be expressed into words or numbers. In contrast, tacit knowledge includes insights and intuitions, and is difficult to transfer to another person by means of simple communications.
Evidently, when information or explicit knowledge is captured and stored in computer, it would become data if the context or intent is devoid.
The final step up the information ladder is the step from knowledge (knowing a lot about a topic) to wisdom. We can say that someone has wisdom when they can combine their knowledge and experience to produce a deeper understanding of a topic. It often takes many years to develop wisdom on a particular topic, and requires patience.
Big Data
Almost all software programs require data to do anything useful. For example, if you are editing a document in a word processor such as Microsoft Word, the document you are working on is the data. The word-processing software can manipulate the data: create a new document, duplicate a document, or modify a document. Some other examples of data are: an MP3 music file, a video file, a spreadsheet, a web page, a social media post, and an e-book.
Recently, big data has been capturing the attention of all types of organizations. The term refers to such massively large data sets that conventional data processing technologies do not have sufficient power to analyze them. For example, Walmart must process millions customer transactions every hour across the world. Storing and analyzing that much data is beyond the power of traditional data management tools. Understanding and developing the best tools and techniques to manage and analyze these large data sets are a problem that governments and businesses alike are trying to solve.
Databases
The goal of many information systems is to transform data into information in order to generate knowledge that can be used for decision making. In order to do this, the system must be able to take data, allow the user to put the data into context, and provide tools for aggregation and analysis. A database is designed for just such a purpose.
Why Databases?
Data is a valuable resource in the organization. However, many people do not know much about database technology, but use non-database tools, such as Excel spreadsheet or Word document, to store and manipulate business data, or use poorly designed databases for business processes. As a result, the data are redundant, inconsistent, inaccurate, and corrupted. For a small data set, the use of non-database tools such as spreadsheet may not cause serious problem. However, for a large organization, corrupted data could lead to serious errors and destructive consequences. The common defects in data resources management are explained as follows.
(1) No control of redundant data
People often keep redundant data for convenience. Redundant data could make the data set inconsistent. We use an illustrative example to explain why redundant data are harmful. Suppose the registrar’s office has two separate files that store student data: one is the registered student roster which records all students who have registered and paid the tuition, and the other is student grade roster which records all students who have received grades.
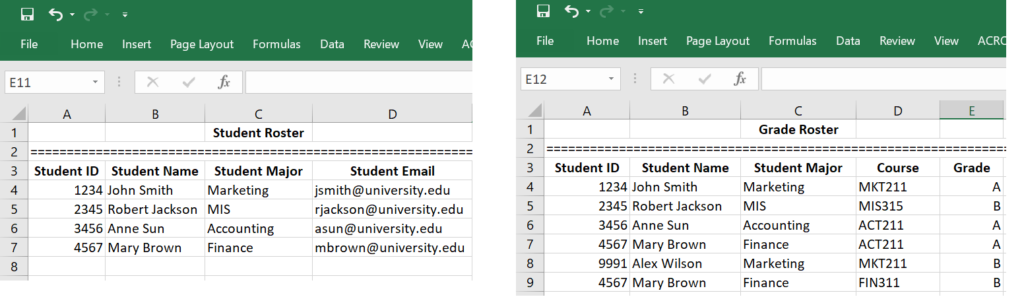
As you can see from the two spreadsheets, this data management system has problems. The fact that “Student 4567 is Mary Brown, and her major is Finance” is stored more than once. Such occurrences are called data redundancy. Redundant data often make data access convenient, but can be harmful. For example, if Mary Brown changes her name or her major, then all her names and major stored in the system must be changed altogether. For small data systems, such a problem looks trivial. However, when the data system is huge, making changes to all redundant data is difficult if not impossible. As a result of data redundancy, the entire data set can be corrupted.
(2) Violation of data integrity
Data integrity means consistency among the stored data. We use the above illustrative example to explain the concept of data integrity and how data integrity can be violated if the data system is flawed. You can find that Alex Wilson received a grade in MKT211; however, you can’t find Alex Wilson in the student roster. That is, the two rosters are not consistent. Suppose we have a data integrity control to enforce the rules, say, “no student can receive a grade unless she/he has registered and paid tuition”, then such a violation of data integrity can never happen.
(3) Relying on human memory to store and to search needed data
The third common mistake in data resource management is the over use of human memory for data search. A human can remember what data are stored and where the data are stored, but can also make mistakes. If a piece of data is stored in an un-remembered place, it has actually been lost. As a result of relying on human memory to store and to search needed data, the entire data set eventually becomes disorganized.
To avoid the above common flaws in data resource management, database technology must be applied. A database is an organized collection of related data. It is an organized collection, because in a database, all data is described and associated with other data. For the purposes of this text, we will only consider computerized databases.
Though not good for replacing databases, spreadsheets can be ideal tools for analyzing the data stored in a database. A spreadsheet package can be connected to a specific table or query in a database and used to create charts or perform analysis on that data.
Data Models and Relational Databases
Databases can be organized in many different ways by using different models. The data model of a database is the logical structure of data items and their relationships. There have been several data models. Since the 1980s, the relational data model has been popularized. Currently, relational database systems are commonly used in business organizations with few exceptions. A relational data model is easy to understand and use.
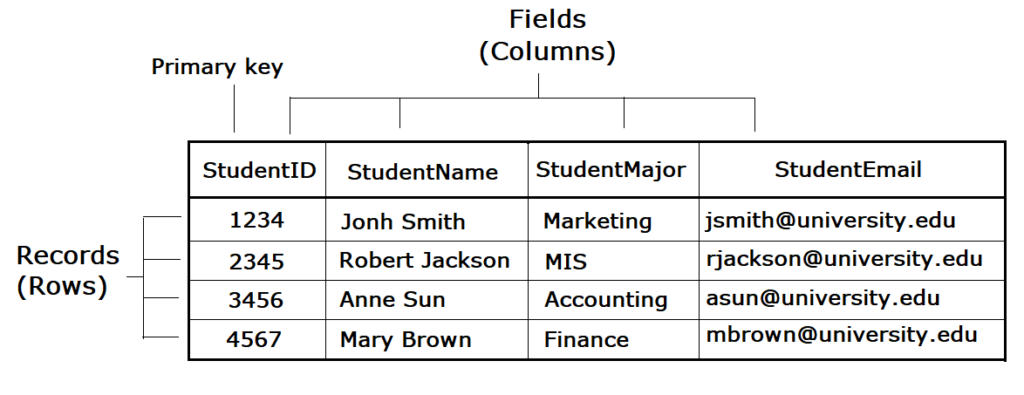
In a relational database, data is organized into tables (or relations). Each table has a set of fields which define the structure of the data stored in the table. A record is one instance of a set of fields in a table. To visualize this, think of the records as the rows (or tuple) of the table and the fields as the columns of the table.
In the example below, we have a table of student data, with each row representing a student record , and each column representing one filed of the student record. A special filed or a combination of fields that determines the unique record is called primary key (or key). A key is usually the unique identification number of the records.
Designing a Database
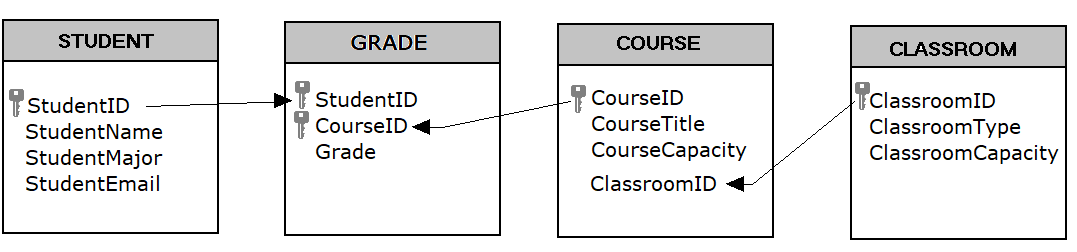
Suppose a university wants to create a School Database to track data. After interviewing several people, the design team learns that the goal of implementing the system is to give better insight into students’ performance and academic resources. From this, the team decides that the system must keep track of the students, their grades, courses, and classrooms. Using this information, the design team determines that the following tables need to be created:
- STUDENT: student name, major, and e-mail.
- COURSE: course title, enrollment capacity.
- GRADE: this table will correlate STUDENT with COURSE, allowing us to have any given student to enroll multiple courses and to receive a grade for each course.
- CLASSROOM: classroom location, classroom type, and classroom capacity
Now that the design team has determined which tables to create, they need to define the specific data items that each table will hold. This requires identifying the fields that will be in each table. For example, course title would be one of the fields in the COURSE table. Finally, since this will be a relational database, every table should have a field in common with at least one other table (in other words, they should have relationships with each other).
A primary key must be selected for each table in a relational database. This key is a unique identifier for each record in the table. For example, in the STUDENT table, it might be possible to use the student name as a way to identify a student. However, it is more than likely that some students share the same name. A student’s e-mail address might be a good choice for a primary key, since e-mail addresses are unique. However, a primary key cannot change, so this would mean that if students changed their e-mail address we would have to remove them from the database and then re-insert them – not an attractive proposition. Our solution is to use student ID as the primary key of the STUDENT table. We will also do this for the COURSE table and the CLASSROOM table. This solution is quite common and is the reason you have so many IDs! The primary key of table can be just one field, but can also be a combination of two or more fields. For example, the combination of StudentID and CourseID the GRADE table can be the primary key of the GRADE table, which means that a grade is received by a particular student for a specific course.
The next step of design of database is to identify and make the relationships between the tables so that you can pull the data together in meaningful ways. A relationship between two tables is implemented by using a foreign key. A foreign key is a field in one table that connects to the primary key data in the original table. For example, ClassroomID in the COURSE table is the foreign key that connects to the primary key ClassroomID in the CLASSROOM table. With this design, not only do we have a way to organize all of the data we need and have successfully related all the table together to meet the requirements, but have also prevented invalid data from being entered into the database. You can see the final database design in the figure below:
Normalization
When designing a database, one important concept to understand is normalization. In simple terms, to normalize a database means to design it in a way that: 1) reduces data redundancy; and 2) ensure data integrity.
In the School Database design, the design team worked to achieve these objectives. For example, to track grades, a simple (and wrong) solution might have been to create a Student field in the COURSE table and then just list the names of all of the students there. However, this design would mean that if a student takes two or more courses, then his or her data would have to be entered twice or more times. This means the data are redundant. Instead, the designers solved this problem by introducing the GRADE table.
In this design, when a student registers into the school system before taking a course, we first must add the student to the STUDENT table, where their ID, name, major, and e-mail address are entered. Now we will add a new entry to denote that the student takes a specific course. This is accomplished by adding a record with the StudentD and the CourseID in the GRADE table. If this student takes a second course, we do not have to duplicate the entry of the student’s name, major, and e-mail; instead, we only need to make another entry in the GRADE table of the second course’s ID and the student’s ID.
The design of the School database also makes it simple to change the design without major modifications to the existing structure. For example, if the design team were asked to add functionality to the system to track instructors who teach the courses, we could easily accomplish this by adding a PROFESSOR table (similar to the STUDENT table) and then adding a new field to the COURSE table to hold the professors’ ID.
Data Types
When defining the fields in a database table, we must give each field a data type. For example, the field StudentName is text string, while EnrollmentCapacity is number. Most modern databases allow for several different data types to be stored. Some of the more common data types are listed here:
- Text: for storing non-numeric data that is brief, generally under 256 characters. The database designer can identify the maximum length of the text.
- Number: for storing numbers. There are usually a few different number types that can be selected, depending on how large the largest number will be.
- Boolean: a data type with only two possible values, such as 0 or 1, “true” or “false”, “yes” or “no”.
- Date/Time: a special form of the number data type that can be interpreted as a number or a time.
- Currency: a special form of the number data type that formats all values with a currency indicator and two decimal places.
- Paragraph Text: this data type allows for text longer than 256 characters.
- Object: this data type allows for the storage of data that cannot be entered via keyboard, such as an image or a music file.
There are two important reasons that we must properly define the data type of a field. First, a data type tells the database what functions can be performed with the data. For example, if we wish to perform mathematical functions with one of the fields, we must be sure to tell the database that the field is a number data type. For example, we can subtract the course capacity from the classroom capacity to find out the number of extra seats available.
The second important reason to define data type is so that the proper amount of storage space is allocated for our data. For example, if the StudentName field is defined as a Text(50) data type, this means 50 characters are allocated for each name we want to store. If a student’s name is longer than 50 characters, the database will truncate it.
Database Management Systems
To the computer, a database looks like one or more files. In order for the data in the database to be stored, read, changed, added, or removed, a software program must access it. Many software applications have this ability: iTunes can read its database to give you a listing of its songs (and play the songs); your mobile-phone software can interact with your list of contacts. But what about applications to create or manage a database? What software can you use to create a database, change a database’s structure, or simply do analysis? That is the purpose of a category of software applications called database management systems (DBMS).
DBMS packages generally provide an interface to view and change the design of the database, create queries, and develop reports. Most of these packages are designed to work with a specific type of database, but generally are compatible with a wide range of databases.
A database that can only be used by a single user at a time is not going to meet the needs of most organizations. As computers have become networked and are now joined worldwide via the Internet, a class of database has emerged that can be accessed by two, ten, or even a million people. These databases are sometimes installed on a single computer to be accessed by a group of people at a single location. Other times, they are installed over several servers worldwide, meant to be accessed by millions. In enterprises the relational DBMS are built and supported by companies such as Oracle, Microsoft SQL Server, and IBM Db2. The open-source MySQL is also an enterprise database.
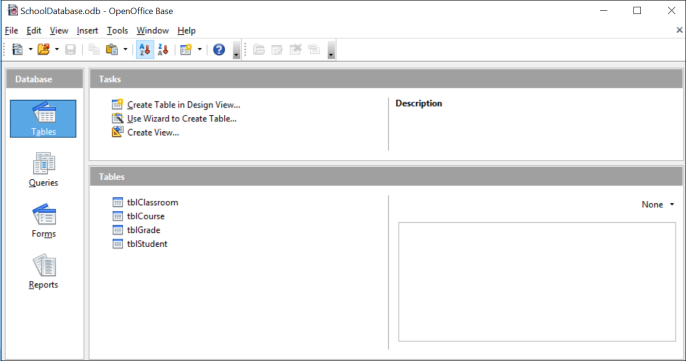
Microsoft Access and Open Office Base are examples of personal database-management systems. These systems are primarily used to develop and analyze single-user databases. These databases are not meant to be shared across a network or the Internet, but are instead installed on a particular device and work with a single user at a time. Apache OpenOffice.org Base (see screen shot) can be used to create, modify, and analyze databases in open-database (ODB) format. Microsoft’s Access DBMS is used to work with databases in its own Microsoft Access Database format. Both Access and Base have the ability to read and write to other database formats as well.
Structured Query Language
Once you have a database designed and loaded with data, how will you do something useful with it? The primary way to work with a relational database is to use Structured Query Language, SQL (pronounced “sequel,” or simply stated as S-Q-L). Almost all applications that work with databases (such as database management systems, discussed below) make use of SQL as a way to analyze and manipulate relational data. As its name implies, SQL is a language that can be used to work with a relational database. From a
simple request for data to a complex update operation, SQL is a mainstay of programmers and database administrators. To give you a taste of what SQL might look like, here are a couple of examples using our School database:
The following query will retrieve the major of student John Smith from the STUDENT table:
SELECT StudentMajor
FROM STUDENT
WHERE StudentName = ‘John Smith’;
The following query will list the total number of students in the STUDENT table:
SELECT COUNT(*)
FROM STUDENT;
SQL can be embedded in many computer languages that are used to develop platform-independent web-based applications. An in-depth description of how SQL works is beyond the scope of this introductory text, but these examples should give you an idea of the power of using SQL to manipulate relational databases. Many DBMS, such as Microsoft Access, allow you to use QBE (Query-by-Example), a graphical query tool, to retrieve data though visualized commands. QBE generates SQL for you, and is easy to use. In comparison with SQL, QBE has limited functionalities and is unable to work without the DBMS environment.
Other Types of Databases
The relational database model is the most used database model today. However, many other database models exist that provide different strengths than the relational model. The hierarchical database model, popular in the 1960s and 1970s, connected data together in a hierarchy, allowing for a parent/child relationship between data. The document-centric model allowed for a more unstructured data storage by placing data into “documents” that could then be manipulated.
Perhaps the most interesting new development is the concept of NoSQL (from the phrase “not only SQL”). NoSQL arose from the need to solve the problem of large-scale databases spread over several servers or even across the world. For a relational database to work properly, it is important that only one person be able to manipulate a piece of data at a time, a concept known as record-locking. But with today’s large-scale databases (think Google and Amazon), this is just not possible. A NoSQL database can work with data in a looser way, allowing for a more unstructured environment, communicating changes to the data over time to all the servers that are part of the database.
As stated earlier, the relational database model does not scale well. The term scale here refers to a database getting larger and larger, being distributed on a larger number of computers connected via a network. Some companies are looking to provide large-scale database solutions by moving away from the relational model to other, more flexible models. For example, Google now offers the App Engine Datastore, which is based on NoSQL. Developers can use the App Engine Datastore to develop applications that access data from anywhere in the world. Amazon.com offers several database services for enterprise use, including Amazon RDS, which is a relational database service, and Amazon DynamoDB, a NoSQL enterprise solution.
Sidebar: What Is Metadata?
The term metadata can be understood as “data about data.” Examples of metadata of database are:
- number of records
- data type of field
- size of field
- description of field
- default value of field
- rules of use.
When a database is being designed, a “data dictionary” is created to hold the metadata, defining the fields and structure of the database.
Finding Value in Data: Business Intelligence
With the rise of Big Data and a myriad of new tools and techniques at their disposal, businesses are learning how to use information to their advantage. The term business intelligence is used to describe the process that organizations use to take data they are collecting and analyze it in the hopes of obtaining a competitive advantage. Besides using their own data, stored in data warehouses (see below), firms often purchase information from data brokers to get a big-picture understanding of their industries and the economy. The results of these analyses can drive organizational strategies and provide competitive advantage.
Data Visualization
Data visualization is the graphical representation of information and data. These graphical representations (such as charts, graphs, and maps) can quickly summarize data in a way that is more intuitive and can lead to new insights and understandings. Just as a picture of a landscape can convey much more than a paragraph of text attempting to describe it, graphical representation of data can quickly make meaning of large amounts of data. Many times, visualizing data is the first step towards a deeper analysis and understanding of the data collected by an organization. Examples of data visualization software include Tableau and Google Data Studio.
Data Warehouses
As organizations have begun to utilize databases as the centerpiece of their operations, the need to fully understand and leverage the data they are collecting has become more and more apparent. However, directly analyzing the data that is needed for day-to-day operations is not a good idea; we do not want to tax the operations of the company more than we need to. Further, organizations also want to analyze data in a historical sense: How does the data we have today compare with the same set of data this time last month, or last year? From these needs arose the concept of the data warehouse.
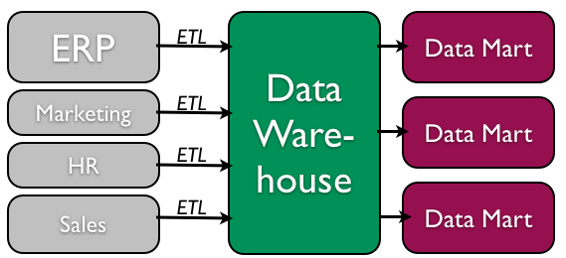
The concept of the data warehouse is simple: extract data from one or more of the organization’s databases and load it into the data warehouse (which is itself another database) for storage and analysis. However, the execution of this concept is not that simple. A data warehouse should be designed so that it meets the following criteria:
- It uses non-operational data. This means that the data warehouse is using a copy of data from the active databases that the company uses in its day-to-day operations, so the data warehouse must pull data from the existing databases on a regular, scheduled basis.
- The data is time-variant. This means that whenever data is loaded into the data warehouse, it receives a time stamp, which allows for comparisons between different time periods.
- The data is standardized. Because the data in a data warehouse usually comes from several different sources, it is possible that the data does not use the same definitions or units. For example, each database uses its own format for dates (e.g., mm/dd/yy, or dd/mm/yy, or yy/mm/dd, etc.). In order for the data warehouse to match up dates, a standard date format would have to be agreed upon and all data loaded into the data warehouse would have to be converted to use this standard format. This process is called extraction-transformation-load (ETL).
There are two primary schools of thought when designing a data warehouse: bottom-up and top-down. The bottom-up approach starts by creating small data warehouses, called data marts, to solve specific business problems. As these data marts are created, they can be combined into a larger data warehouse. The top- down approach suggests that we should start by creating an enterprise-wide data warehouse and then, as specific business needs are identified, create smaller data marts from the data warehouse.
Benefits of Data Warehouses
Organizations find data warehouses quite beneficial for a number of reasons:
- The process of developing a data warehouse forces an organization to better understand the data that it is currently collecting and, equally important, what data is not being collected.
- A data warehouse provides a centralized view of all data being collected across the enterprise and provides a means for determining data that is inconsistent.
- Once all data is identified as consistent, an organization can generate “one version of the truth”. This is important when the company wants to report consistent statistics about itself, such as revenue or number of employees.
- By having a data warehouse, snapshots of data can be taken over time. This creates a historical record of data, which allows for an analysis of trends.
- A data warehouse provides tools to combine data, which can provide new information and analysis.
Data Mining and Machine Learning
Data mining is the process of analyzing data to find previously unknown and interesting trends, patterns, and associations in order to make decisions. Generally, data mining is accomplished through automated means against extremely large data sets, such as a data warehouse. Some examples of data mining include:
- An analysis of sales from a large grocery chain might determine that milk is purchased more frequently the day after it rains in cities with a population of less than 50,000.
- A bank may find that loan applicants whose bank accounts show particular deposit and withdrawal patterns are not good credit risks.
- A baseball team may find that collegiate baseball players with specific statistics in hitting, pitching, and fielding make for more successful major league players.
One data mining method that an organization can use to do these analyses is called machine learning. Machine learning is used to analyze data and build models without being explicitly programmed to do so. Two primary branches of machine learning exist: supervised learning and unsupervised learning.
Supervised learning occurs when an organization has data about past activity that has occurred and wants to replicate it. For example, if they want to create a new marketing campaign for a particular product line, they may look at data from past marketing campaigns to see which of their consumers responded most favorably. Once the analysis is done, a machine learning model is created that can be used to identify these new customers. It is called “supervised” learning because we are directing (supervising) the analysis towards a result (in our example: consumers who respond favorably). Supervised learning techniques include analyses such as decision trees, neural networks, classifiers, and logistic regression.
Unsupervised learning occurs when an organization has data and wants to understand the relationship(s) between different data points. For example, if a retailer wants to understand purchasing patterns of its customers, an unsupervised learning model can be developed to find out which products are most often purchased together or how to group their customers by purchase history. Is it called “unsupervised” learning because no specific outcome is expected. Unsupervised learning techniques include clustering and association rules.
Privacy Concerns
The increasing power of data mining has caused concerns for many, especially in the area of privacy. In today’s digital world, it is becoming easier than ever to take data from disparate sources and combine them to do new forms of analysis. In fact, a whole industry has sprung up around this technology: data brokers. These firms combine publicly accessible data with information obtained from the government and other sources to create vast warehouses of data about people and companies that they can then sell. This subject will be covered in much more detail in chapter 12 – the chapter on the ethical concerns of information systems.
Sidebar: What is data science? What is data analytics?
The term “data science” is a popular term meant to describe the analysis of large data sets to find new knowledge. For the past several years, it has been considered one of the best career fields to get into due to its explosive growth and high salaries. While a data scientist does many different things, their focus is generally on analyzing large data sets using various programming methods and software tools to create new knowledge for their organization. Data scientists are skilled in machine learning and data visualization techniques. The field of data science is constantly changing, and data scientists are on the cutting edge of work in areas such as artificial intelligence and neural networks.
Knowledge Management
We end the chapter with a discussion on the concept of knowledge management (KM). All companies accumulate knowledge over the course of their existence. Some of this knowledge is written down or saved, but not in an organized fashion. Much of this knowledge is not written down; instead, it is stored inside the heads of its employees. Knowledge management is the process of creating, formalizing the capture, indexing, storing, and sharing of the company’s knowledge in order to benefit from the experiences and insights that the company has captured during its existence.
Summary
In this chapter, we learned about the role that data and databases play in the context of information systems. Data is made up of facts of the world. If you process data in a particular context, then you have information. Knowledge is gained when information is consumed and used for decision making. A database is an organized collection of related data. Relational databases are the most widely used type of database, where data is structured into tables and all tables must be related to each other through unique identifiers. A database management system (DBMS) is a software application that is used to create and manage databases, and can take the form of a personal DBMS, used by one person, or an enterprise DBMS that can be used by multiple users. A data warehouse is a special form of database that takes data from other databases in an enterprise and organizes it for analysis. Data mining is the process of looking for patterns and relationships in large data sets. Many businesses use databases, data warehouses, and data-mining techniques in order to produce business intelligence and gain a competitive advantage.
Study Questions
- What is the difference between data, information, and knowledge?
- Explain in your own words how the data component relates to the hardware and software components of information systems.
- What is the difference between quantitative data and qualitative data? In what situations could the number 42 be considered qualitative data?
- What are the characteristics of a relational database?
- When would using a personal DBMS make sense?
- What is the difference between a spreadsheet and a database? List three differences between them.
- Describe what the term normalization means.
- Why is it important to define the data type of a field when designing a relational database?
- Name a database you interact with frequently. What would some of the field names be?
- What is metadata?
- Name three advantages of using a data warehouse.
- What is data mining?
- In your own words, explain the difference between supervised learning and unsupervised learning. Give an example of each (not from the book).
Exercises
- Review the design of the School database earlier in this chapter. Reviewing the lists of data types given, what data types would you assign to each of the fields in each of the tables. What lengths would you assign to the text fields?
- Download Apache OpenOffice.org and use the database tool to open the “Student Clubs.odb” file available here. Take some time to learn how to modify the database structure and then see if you can add the required items to support the tracking of faculty advisors, as described at the end of the Normalization section in the chapter. Here is a link to the Getting Started documentation.
- Using Microsoft Access, download the database file of comprehensive baseball statistics from the website SeanLahman.com. (If you don’t have Microsoft Access, you can download an abridged version of the file here that is compatible with Apache Open Office). Review the structure of the tables included in the database. Come up with three different data-mining experiments you would like to try, and explain which fields in which tables would have to be analyzed.
- Do some original research and find two examples of data mining. Summarize each example and then write about what the two examples have in common.
- Conduct some independent research on the process of business intelligence. Using at least two scholarly or practitioner sources, write a two-page paper giving examples of how business intelligence is being used.
- Conduct some independent research on the latest technologies being used for knowledge management. Using at least two scholarly or practitioner sources, write a two-page paper giving examples of software applications or new technologies being used in this field.