
2.8: Infiltration
- Page ID
- 44333
\( \newcommand{\vecs}[1]{\overset { \scriptstyle \rightharpoonup} {\mathbf{#1}} } \)
\( \newcommand{\vecd}[1]{\overset{-\!-\!\rightharpoonup}{\vphantom{a}\smash {#1}}} \)
\( \newcommand{\dsum}{\displaystyle\sum\limits} \)
\( \newcommand{\dint}{\displaystyle\int\limits} \)
\( \newcommand{\dlim}{\displaystyle\lim\limits} \)
\( \newcommand{\id}{\mathrm{id}}\) \( \newcommand{\Span}{\mathrm{span}}\)
( \newcommand{\kernel}{\mathrm{null}\,}\) \( \newcommand{\range}{\mathrm{range}\,}\)
\( \newcommand{\RealPart}{\mathrm{Re}}\) \( \newcommand{\ImaginaryPart}{\mathrm{Im}}\)
\( \newcommand{\Argument}{\mathrm{Arg}}\) \( \newcommand{\norm}[1]{\| #1 \|}\)
\( \newcommand{\inner}[2]{\langle #1, #2 \rangle}\)
\( \newcommand{\Span}{\mathrm{span}}\)
\( \newcommand{\id}{\mathrm{id}}\)
\( \newcommand{\Span}{\mathrm{span}}\)
\( \newcommand{\kernel}{\mathrm{null}\,}\)
\( \newcommand{\range}{\mathrm{range}\,}\)
\( \newcommand{\RealPart}{\mathrm{Re}}\)
\( \newcommand{\ImaginaryPart}{\mathrm{Im}}\)
\( \newcommand{\Argument}{\mathrm{Arg}}\)
\( \newcommand{\norm}[1]{\| #1 \|}\)
\( \newcommand{\inner}[2]{\langle #1, #2 \rangle}\)
\( \newcommand{\Span}{\mathrm{span}}\) \( \newcommand{\AA}{\unicode[.8,0]{x212B}}\)
\( \newcommand{\vectorA}[1]{\vec{#1}} % arrow\)
\( \newcommand{\vectorAt}[1]{\vec{\text{#1}}} % arrow\)
\( \newcommand{\vectorB}[1]{\overset { \scriptstyle \rightharpoonup} {\mathbf{#1}} } \)
\( \newcommand{\vectorC}[1]{\textbf{#1}} \)
\( \newcommand{\vectorD}[1]{\overrightarrow{#1}} \)
\( \newcommand{\vectorDt}[1]{\overrightarrow{\text{#1}}} \)
\( \newcommand{\vectE}[1]{\overset{-\!-\!\rightharpoonup}{\vphantom{a}\smash{\mathbf {#1}}}} \)
\( \newcommand{\vecs}[1]{\overset { \scriptstyle \rightharpoonup} {\mathbf{#1}} } \)
\(\newcommand{\longvect}{\overrightarrow}\)
\( \newcommand{\vecd}[1]{\overset{-\!-\!\rightharpoonup}{\vphantom{a}\smash {#1}}} \)
\(\newcommand{\avec}{\mathbf a}\) \(\newcommand{\bvec}{\mathbf b}\) \(\newcommand{\cvec}{\mathbf c}\) \(\newcommand{\dvec}{\mathbf d}\) \(\newcommand{\dtil}{\widetilde{\mathbf d}}\) \(\newcommand{\evec}{\mathbf e}\) \(\newcommand{\fvec}{\mathbf f}\) \(\newcommand{\nvec}{\mathbf n}\) \(\newcommand{\pvec}{\mathbf p}\) \(\newcommand{\qvec}{\mathbf q}\) \(\newcommand{\svec}{\mathbf s}\) \(\newcommand{\tvec}{\mathbf t}\) \(\newcommand{\uvec}{\mathbf u}\) \(\newcommand{\vvec}{\mathbf v}\) \(\newcommand{\wvec}{\mathbf w}\) \(\newcommand{\xvec}{\mathbf x}\) \(\newcommand{\yvec}{\mathbf y}\) \(\newcommand{\zvec}{\mathbf z}\) \(\newcommand{\rvec}{\mathbf r}\) \(\newcommand{\mvec}{\mathbf m}\) \(\newcommand{\zerovec}{\mathbf 0}\) \(\newcommand{\onevec}{\mathbf 1}\) \(\newcommand{\real}{\mathbb R}\) \(\newcommand{\twovec}[2]{\left[\begin{array}{r}#1 \\ #2 \end{array}\right]}\) \(\newcommand{\ctwovec}[2]{\left[\begin{array}{c}#1 \\ #2 \end{array}\right]}\) \(\newcommand{\threevec}[3]{\left[\begin{array}{r}#1 \\ #2 \\ #3 \end{array}\right]}\) \(\newcommand{\cthreevec}[3]{\left[\begin{array}{c}#1 \\ #2 \\ #3 \end{array}\right]}\) \(\newcommand{\fourvec}[4]{\left[\begin{array}{r}#1 \\ #2 \\ #3 \\ #4 \end{array}\right]}\) \(\newcommand{\cfourvec}[4]{\left[\begin{array}{c}#1 \\ #2 \\ #3 \\ #4 \end{array}\right]}\) \(\newcommand{\fivevec}[5]{\left[\begin{array}{r}#1 \\ #2 \\ #3 \\ #4 \\ #5 \\ \end{array}\right]}\) \(\newcommand{\cfivevec}[5]{\left[\begin{array}{c}#1 \\ #2 \\ #3 \\ #4 \\ #5 \\ \end{array}\right]}\) \(\newcommand{\mattwo}[4]{\left[\begin{array}{rr}#1 \amp #2 \\ #3 \amp #4 \\ \end{array}\right]}\) \(\newcommand{\laspan}[1]{\text{Span}\{#1\}}\) \(\newcommand{\bcal}{\cal B}\) \(\newcommand{\ccal}{\cal C}\) \(\newcommand{\scal}{\cal S}\) \(\newcommand{\wcal}{\cal W}\) \(\newcommand{\ecal}{\cal E}\) \(\newcommand{\coords}[2]{\left\{#1\right\}_{#2}}\) \(\newcommand{\gray}[1]{\color{gray}{#1}}\) \(\newcommand{\lgray}[1]{\color{lightgray}{#1}}\) \(\newcommand{\rank}{\operatorname{rank}}\) \(\newcommand{\row}{\text{Row}}\) \(\newcommand{\col}{\text{Col}}\) \(\renewcommand{\row}{\text{Row}}\) \(\newcommand{\nul}{\text{Nul}}\) \(\newcommand{\var}{\text{Var}}\) \(\newcommand{\corr}{\text{corr}}\) \(\newcommand{\len}[1]{\left|#1\right|}\) \(\newcommand{\bbar}{\overline{\bvec}}\) \(\newcommand{\bhat}{\widehat{\bvec}}\) \(\newcommand{\bperp}{\bvec^\perp}\) \(\newcommand{\xhat}{\widehat{\xvec}}\) \(\newcommand{\vhat}{\widehat{\vvec}}\) \(\newcommand{\uhat}{\widehat{\uvec}}\) \(\newcommand{\what}{\widehat{\wvec}}\) \(\newcommand{\Sighat}{\widehat{\Sigma}}\) \(\newcommand{\lt}{<}\) \(\newcommand{\gt}{>}\) \(\newcommand{\amp}{&}\) \(\definecolor{fillinmathshade}{gray}{0.9}\)The reservoir of water in the soil is generally replenished by the process called infiltration, the entry of water through the soil surface. Infiltration is very important in irrigation since the goal is to supply water to the root zone to meet plant needs. In most cases, the goal is that all of the applied irrigation and rain enters the soil, thereby minimizing the amount of water that runs off the soil surface
What causes water to enter the soil? Two things drive infiltration: capillarity and gravity. During the initial stages of a water application, capillary forces dominate water movement into the soil. Capillary forces work equally in all directions. Thus, capillary forces pulling water into the soil are the same in the horizontal and vertical directions. As time progresses, the capillary forces diminish, and gravity becomes the dominant force. This change in the dominant force is illustrated in Figure 2.9a where a wetted pattern under an irrigated furrow is almost semicircular in the early stages of an irrigation, but as infiltration progresses, the wetted pattern elongates in the vertical direction (Figure 2.9b). The elongation is due to the dominance of the gravitational force over capillary forces with time.
Figure 2.9 Wetting patterns early and late during a furrow irrigation water application.

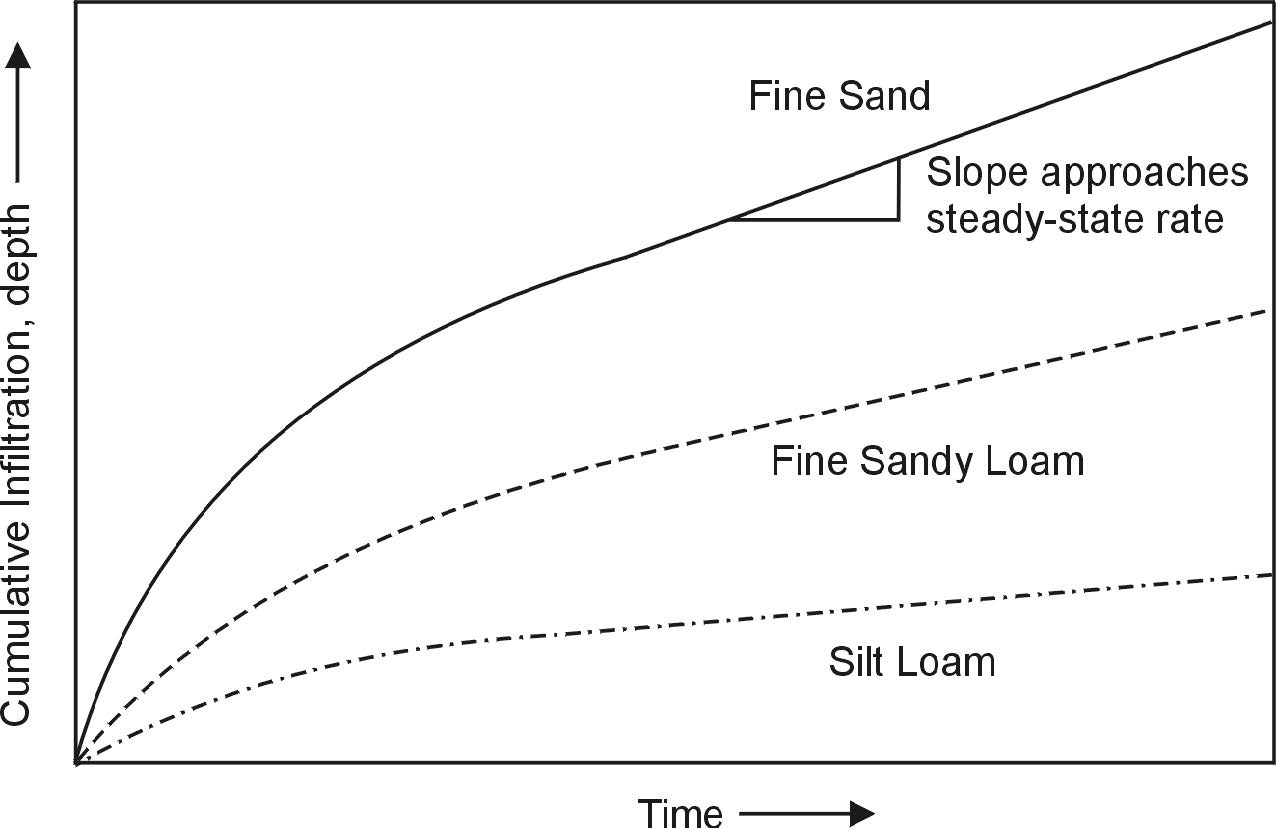
Infiltration can be described in terms of either the rate of infiltration, which is the depth of water that infiltrates per unit of time, or the cumulative amount of water infiltrating over time. Cumulative infiltration is the total depth that has infiltrated after a specific time has elapsed. The curves shown in Figure 2.10 illustrate infiltration rates with time for several soil types. This figure applies where the soil surface is ponded instantaneously as would be the case for surface irrigation (i.e., furrows, borders, and basins). The curves show that initially the infiltration rate is very high and as time progresses, or more correctly, as the amount of water that has infiltrated increases, the rate of infiltration decreases. Therefore, a decay curve results with a decreasing rate of infiltration. As time continues, the infiltration rate will approach a nearly steady rate, sometimes called steady-state rate or basic infiltration rate or basic intake rate. Does the infiltration rate go to zero after a long period of application? No. It can only be zero if the soil is completely impermeable or if there is no gravity (outer space). Cumulative infiltration, or the total depth of water infiltrated over time, is shown in Figure 2.11. The curves in Figure 2.11 show that cumulative depth increases with time, but it is not a straight line. Infiltration accumulates at a fast rate early and then slows later in the irrigation or rainfall event. The slope of the curve approaches the steady-state infiltration rate shown in Figure 2.10. Be careful not to confuse the soil cumulative infiltration or depth of infiltration with the depth to which water has penetrated in the soil. View it as you would water in a rain gauge. The depth of infiltration is analogous to the depth of water in the rain gauge. It is the volume of water that is infiltrated per unit of land area.
Figure 2.10. The rate of infiltration as an irrigation event proceeds and the steady rate of infiltration for three soil textures.

What if ponding does not occur instantaneously such as with a gentle rain or with a stationary sprinkler system that has a constant rate of application? Initially, all of the water that falls from the rain or from the sprinklers will infiltrate the soil. However, if the application period is long, the intensity of the rain or the application rate of the irrigation system may exceed the infiltration capacity of the soil. When this occurs, water will pond on the surface (surface saturation). Once the surface layer is saturated, the infiltration rate begins to follow a curve similar in shape to the ponded water case. Figure 2.12 shows a situation where a stationary sprinkler system applies water at a rate which infiltrates initially, but then, at some point, surface ponding occurs. The irrigation system now is applying water at a rate faster than can be absorbed by the soil. From that time forward, the water not infiltrated is referred to as potential runoff. There is water on the soil surface, and after all the surface depressions are filled, runoff will begin. An ideal stationary sprinkler irrigation system would be designed so that the application rate does not exceed the steady-state infiltration rate of the soil. Thus, no runoff would ever occur. The ideal irrigation system, however, is rarely achieved.
Figure 2.11. Examples of cumulative infiltration for three soil textures.
For a moving sprinkler system, such as a center pivot or a traveling gun, the application pattern would appear similar to that shown in Figure 2.13. The application rate of the system increases with time as the irrigation system approaches a given location until it reaches a peak or maximum, after which it begins to decrease. It creates a symmetrical application rate versus time relationship in the absence of wind. For center pivots, the maximum occurs when the lateral pipe is directly above the given location. As was the case with the stationary sprinkler system, there may be a time when the soil can no longer absorb the water as fast as it is being applied. When surface ponding occurs, the rate of infiltration into the soil decreases as it did in Figure 2.11. Again, the difference between the infiltration rate curve and the system's application rate curve is potential surface runoff.
What factors influence the infiltration rate of the soil? Often, the first thing that comes to mind is the soil texture. We generally think of coarser-textured (sandy) soils having higher infiltration rates than fine- (clay) and medium-textured (loam) soils (Figures 2.10 and 2.11). Table 2.4 shows typical steady-state infiltration rates that can be expected for various soil textures. In theory, if the soils were uniform with depth, and if surface sealing did not occur, the steady-state infiltration rate would be equal to the permeability or saturated hydraulic conductivity of the soil. Permeability is a measure of a soil's ability to transmit water while saturated. The ranges of permeabilities of soils are often listed in soil survey reports (Table 2.2). Usually, ideal conditions do not exist in the field and, hence, various factors reduce the steady-state infiltration rate significantly below the permeability of the soil.
Figure 2.12. Infiltration rate over time for a constant rate of water application that eventually exceeds the infiltration rate of the soil surface.

A major factor affecting infiltration is the method of water application. Infiltration is, in general, higher when the entire surface is wetted compared to only a portion of the surface. Thus, the infiltration rate (volume of water per unit of land area per unit of time) is generally higher for border and basin irrigation than it is for furrow irrigation, because with irrigated furrows the entire soil surface is not in contact with water.
Surface sealing is another factor influencing infiltration rate. Surface sealing occurs in both surface and sprinkler irrigation. With surface irrigation the shearing effect of the flowing water causes the soil aggregates on the surface to decompose into smaller aggregates and individual particles which tend to form a thin layer with low permeability on the soil surface. It is common to find large differences between infiltration during the first irrigation event and infiltration during later irrigation events due to surface sealing.
Figure 2.13. Infiltration rate as a function of time for a moving sprinkler system.

With sprinkler irrigation and rainfall, surfacing sealing is caused by the impact of the falling water drops on any exposed soil aggregates. Again, the aggregates are broken into smaller aggregates and individual particles, thus, forming a surface seal.
Another factor that has a large influence on infiltration is soil cracking. Soils that contain fine soil particles (clays) shrink when drying and swell during wetting. The shrinking soil cracks as it dries. These cracks cause the initial infiltration rate to be high as water flows freely into them. As the soil wets, the clay particles swell and the cracks close, which causes a rapid decrease in the infiltration rate.
Tillage also has a large impact on infiltration rate and, in fact, is often performed to enhance the infiltration rate. Conservation tillage practices that leave crop residues on the soil surface can also enhance infiltration. Crop residue on the surface protects the soil from the impact of water drops from sprinkler irrigation or rainfall, thus, reducing the formation of a surface seal. Likewise, deep tillage (chiseling) is sometimes used to enhance infiltration. Soil water content is another factor that influences infiltration. The wetter the soil, the lower the infiltration rate. The initial infiltration rate of a moist soil is, in general, lower than the initial infiltration rate of an identical dry soil. As time progresses, the infiltration rate of these two conditions will converge to the same steady-state value.
| Soil Texture | Minimal Surface Sealing (in/hr) | Some Surface Sealing (in/hr) |
|---|---|---|
| Coarse sand | 0.75-1.00 | 0.40-0.65 |
| Fine sand | 0.50-0.75 | 0.25-0.50 |
| Fine sandy loam | 0.35-0.50 | 0.15-0.30 |
| Silt loam | 0.25-0.40 | 0.13-0.28 |
| Clay loam | 0.10-0.30 | 0.05-0.25 |
Water temperature is also known to influence infiltration rates because temperature changes the viscosity of water. As temperature increases, the viscosity decreases, hence, the infiltration rate increases (Duke, 1992). The influence of this factor is often noticed where relatively cool groundwater is applied at the head of a surface irrigated field and begins to advance across the field. On a hot day, as the water moves across the field, it is warmed. As the water warms, the infiltration rate can go up and, thus, create a differential between the infiltration rate at the inlet end and the downstream end of the field. Sometimes this phenomenon is noticed when water in furrows that has already advanced to nearly the end of the field during the early, cool part of a day may actually recede back up the field as the day progresses. This observation is often incorrectly associated with a higher rate of evaporation from the water surface. In reality, the increased water temperature has increased the infiltration rate.