5.1.2: Databases - Basic Concepts
- Page ID
- 10122
\( \newcommand{\vecs}[1]{\overset { \scriptstyle \rightharpoonup} {\mathbf{#1}} } \)
\( \newcommand{\vecd}[1]{\overset{-\!-\!\rightharpoonup}{\vphantom{a}\smash {#1}}} \)
\( \newcommand{\id}{\mathrm{id}}\) \( \newcommand{\Span}{\mathrm{span}}\)
( \newcommand{\kernel}{\mathrm{null}\,}\) \( \newcommand{\range}{\mathrm{range}\,}\)
\( \newcommand{\RealPart}{\mathrm{Re}}\) \( \newcommand{\ImaginaryPart}{\mathrm{Im}}\)
\( \newcommand{\Argument}{\mathrm{Arg}}\) \( \newcommand{\norm}[1]{\| #1 \|}\)
\( \newcommand{\inner}[2]{\langle #1, #2 \rangle}\)
\( \newcommand{\Span}{\mathrm{span}}\)
\( \newcommand{\id}{\mathrm{id}}\)
\( \newcommand{\Span}{\mathrm{span}}\)
\( \newcommand{\kernel}{\mathrm{null}\,}\)
\( \newcommand{\range}{\mathrm{range}\,}\)
\( \newcommand{\RealPart}{\mathrm{Re}}\)
\( \newcommand{\ImaginaryPart}{\mathrm{Im}}\)
\( \newcommand{\Argument}{\mathrm{Arg}}\)
\( \newcommand{\norm}[1]{\| #1 \|}\)
\( \newcommand{\inner}[2]{\langle #1, #2 \rangle}\)
\( \newcommand{\Span}{\mathrm{span}}\) \( \newcommand{\AA}{\unicode[.8,0]{x212B}}\)
\( \newcommand{\vectorA}[1]{\vec{#1}} % arrow\)
\( \newcommand{\vectorAt}[1]{\vec{\text{#1}}} % arrow\)
\( \newcommand{\vectorB}[1]{\overset { \scriptstyle \rightharpoonup} {\mathbf{#1}} } \)
\( \newcommand{\vectorC}[1]{\textbf{#1}} \)
\( \newcommand{\vectorD}[1]{\overrightarrow{#1}} \)
\( \newcommand{\vectorDt}[1]{\overrightarrow{\text{#1}}} \)
\( \newcommand{\vectE}[1]{\overset{-\!-\!\rightharpoonup}{\vphantom{a}\smash{\mathbf {#1}}}} \)
\( \newcommand{\vecs}[1]{\overset { \scriptstyle \rightharpoonup} {\mathbf{#1}} } \)
\( \newcommand{\vecd}[1]{\overset{-\!-\!\rightharpoonup}{\vphantom{a}\smash {#1}}} \)
\(\newcommand{\avec}{\mathbf a}\) \(\newcommand{\bvec}{\mathbf b}\) \(\newcommand{\cvec}{\mathbf c}\) \(\newcommand{\dvec}{\mathbf d}\) \(\newcommand{\dtil}{\widetilde{\mathbf d}}\) \(\newcommand{\evec}{\mathbf e}\) \(\newcommand{\fvec}{\mathbf f}\) \(\newcommand{\nvec}{\mathbf n}\) \(\newcommand{\pvec}{\mathbf p}\) \(\newcommand{\qvec}{\mathbf q}\) \(\newcommand{\svec}{\mathbf s}\) \(\newcommand{\tvec}{\mathbf t}\) \(\newcommand{\uvec}{\mathbf u}\) \(\newcommand{\vvec}{\mathbf v}\) \(\newcommand{\wvec}{\mathbf w}\) \(\newcommand{\xvec}{\mathbf x}\) \(\newcommand{\yvec}{\mathbf y}\) \(\newcommand{\zvec}{\mathbf z}\) \(\newcommand{\rvec}{\mathbf r}\) \(\newcommand{\mvec}{\mathbf m}\) \(\newcommand{\zerovec}{\mathbf 0}\) \(\newcommand{\onevec}{\mathbf 1}\) \(\newcommand{\real}{\mathbb R}\) \(\newcommand{\twovec}[2]{\left[\begin{array}{r}#1 \\ #2 \end{array}\right]}\) \(\newcommand{\ctwovec}[2]{\left[\begin{array}{c}#1 \\ #2 \end{array}\right]}\) \(\newcommand{\threevec}[3]{\left[\begin{array}{r}#1 \\ #2 \\ #3 \end{array}\right]}\) \(\newcommand{\cthreevec}[3]{\left[\begin{array}{c}#1 \\ #2 \\ #3 \end{array}\right]}\) \(\newcommand{\fourvec}[4]{\left[\begin{array}{r}#1 \\ #2 \\ #3 \\ #4 \end{array}\right]}\) \(\newcommand{\cfourvec}[4]{\left[\begin{array}{c}#1 \\ #2 \\ #3 \\ #4 \end{array}\right]}\) \(\newcommand{\fivevec}[5]{\left[\begin{array}{r}#1 \\ #2 \\ #3 \\ #4 \\ #5 \\ \end{array}\right]}\) \(\newcommand{\cfivevec}[5]{\left[\begin{array}{c}#1 \\ #2 \\ #3 \\ #4 \\ #5 \\ \end{array}\right]}\) \(\newcommand{\mattwo}[4]{\left[\begin{array}{rr}#1 \amp #2 \\ #3 \amp #4 \\ \end{array}\right]}\) \(\newcommand{\laspan}[1]{\text{Span}\{#1\}}\) \(\newcommand{\bcal}{\cal B}\) \(\newcommand{\ccal}{\cal C}\) \(\newcommand{\scal}{\cal S}\) \(\newcommand{\wcal}{\cal W}\) \(\newcommand{\ecal}{\cal E}\) \(\newcommand{\coords}[2]{\left\{#1\right\}_{#2}}\) \(\newcommand{\gray}[1]{\color{gray}{#1}}\) \(\newcommand{\lgray}[1]{\color{lightgray}{#1}}\) \(\newcommand{\rank}{\operatorname{rank}}\) \(\newcommand{\row}{\text{Row}}\) \(\newcommand{\col}{\text{Col}}\) \(\renewcommand{\row}{\text{Row}}\) \(\newcommand{\nul}{\text{Nul}}\) \(\newcommand{\var}{\text{Var}}\) \(\newcommand{\corr}{\text{corr}}\) \(\newcommand{\len}[1]{\left|#1\right|}\) \(\newcommand{\bbar}{\overline{\bvec}}\) \(\newcommand{\bhat}{\widehat{\bvec}}\) \(\newcommand{\bperp}{\bvec^\perp}\) \(\newcommand{\xhat}{\widehat{\xvec}}\) \(\newcommand{\vhat}{\widehat{\vvec}}\) \(\newcommand{\uhat}{\widehat{\uvec}}\) \(\newcommand{\what}{\widehat{\wvec}}\) \(\newcommand{\Sighat}{\widehat{\Sigma}}\) \(\newcommand{\lt}{<}\) \(\newcommand{\gt}{>}\) \(\newcommand{\amp}{&}\) \(\definecolor{fillinmathshade}{gray}{0.9}\)Learning Objectives
- Identify the basic organization and components of a database.
In December 2013, Target, Inc., announced that a security breach had allowed unauthorized individuals to gain access to information about customers who had recently shopped at Target and used a credit card or debit card to make purchases. Then in January 2014, Neiman Marcus reported the same problem: Unauthorized people had accessed its database and taken shoppers’ personal information, including names, addresses, phone numbers, and e-mail addresses. Both of these security breaches had grave implications for the personally identifiable information (PII) of the shoppers, with the potential for these unauthorized persons to complete credit card or loan applications, make unauthorized purchases, and potentially impact credit ratings for millions of customers of these two stores.
All of the data about the customers had been stored in databases. What makes it so convenient to simply swipe your credit card or debit card when making a purchase, and to have the purchase approved almost instantaneously, is also what makes these security breaches so potentially devastating. All of the information the store needs for billing—your card numbers, billing address, phone number, e-mail address, and more—is stored in large databases maintained by the store. This collection of data about you is organized in such a way that retrieval of the information can be done in seconds. That is the strength of databases and database software.
Basic Organization of a Database
So, what is a database? It is a computer-based collection of related pieces of data organized so that the data can readily be accessed, managed, and updated. As you recall, computers work with the binary system where a bit is the smallest entity represented and is either a one (on) or a zero (off). Together eight bits combine to form a byte which represents one character. The characters represented by bytes may be letters, numbers, and/or special symbols. By themselves, characters generally are not meaningful, but they combine to form meaningful data such as your first name. Your first name consists of a set of characters ultimately stored as bits in the computer.
Databases operate by organizing data into meaningful groupings called fields, records, tables, and finally databases.
- Fields, which contain one or more characters or an audio, video or image file. Fields can be designed to hold only character data or only numeric data, or they can be designed to hold other types of data, such as images or audio or video files or a hyperlink to a website or other information source. For instance, one field might contain a first name, another field a last name, another the street portion of an address, and so on. Each field is given a specific name. You can visualize fields as being organized in columns of a particular table in the database.
- Records, a collection of related fields, usually organized in a row. The record contains all of the information related to a specific entity—a person, a place, a thing, or an event. For example, a record might contain a first name, a last name, and a social security number. You can visualize the records as being organized into rows in a particular table, where all the components of a single row are made up of fields that represent characteristics of a person, place, thing, or event.
- Tables, collections of related records. A table contains all the records for a particular group or type of thing or event.
- Database, a collection of related tables and other objects such as queries, forms, and reports, that help users view data in meaningful ways.
The overall organization of the database, then, moves from the smallest piece of meaningful information (the field) through records and tables to the database itself which contains tables, queries, forms and reports.
Interacting with a Database
Database software, also called a database management system or DBMS, allows users to interact with the database at all levels of the hierarchy. After a database structure is designed and the structure is implemented by creating the fields and tables, data is entered typically via a data entry form, a window on the screen that allows the user to enter data into the fields that make up a record. Data can also be modified via the form.
Database software, also called a database management system or DBMS, allows users to interact with the database at all levels of the hierarchy.
A query is a way of retrieving data from the database via specification of criteria that identify exactly what data is to be retrieved and how it might be sorted and displayed. Data can also be modified via the query.
Reports are also used to retrieve data from the database, in which the user can specify how the retrieved data are presented. Reports can be displayed, printed, or shared. Reports can also be used for things like mailing labels.
The term file maintenance refers to procedures that keep data current in the database. File maintenance supports adding, modifying, or deleting records, and creating backup copies of the database.
If you are familiar with Microsoft Access, you perhaps have used wizards to help you create required elements of your project. A wizard is a software application that is used to create tables, queries, and reports. The wizard itself is not used to enter or modify data in the fields or records.
Did I Get This? \(\PageIndex{1}\)
Different Database Models
All databases are composed of the elements identified above. But the organization of the records and tables can be quite different. What are the various models used for structuring a database? The older, less efficient models were the hierarchical and network models. Both models were restricted in that the organization of data had to be defined up front, making the structure quite inflexible. It was difficult to add new fields or tables to the database.
Hierarchical Model
The structure was predefined. If new fields were needed, the entire database had to be redefined. This diagram represents an example of the hierarchical structure:
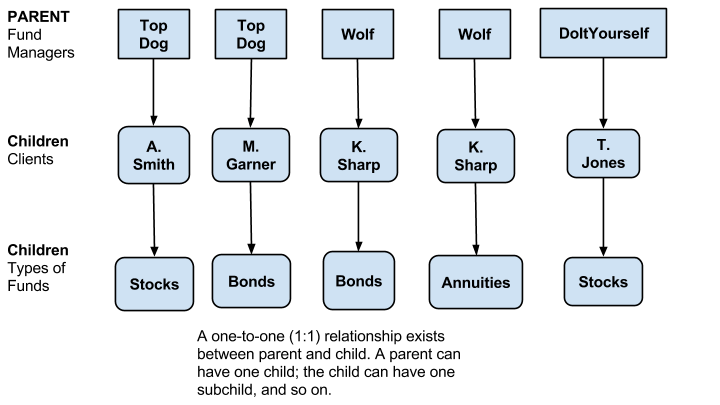
Figure \(\PageIndex{1}\): CC-BY by Janet Zimmer.
The top field—in this example, Fund Manager—was called the “parent,” and the other fields (clients and types of funds) were called the “children” of that parent. There was no way to relate the children of one parent with the children of another—no common key field. For example, it was impossible to retrieve just a list of the client names (a child field) from all the fund manager records without retrieving all the data for allthe fund managers. Think about it as an all-or-nothing situation. To enter the data about an item, person, or place, or even to retrieve even one piece of information about that same item, the entire record for that item had to be retrieved or opened up for editing. If you wanted to know what funds Wolf was managing, you had to retrieve the entire record wherever Wolf’s name appeared as the Fund Manager; that is, the Fund Manager’s name, the client name, and which funds this client was invested in. You can see the inefficiency in this structure and why a newer model quickly developed.
Network Model
The network database was an extension of the hierarchical model. It allowed a parent record to have more than one child, and child records to be related to more than one subchild record. It was more flexible than the hierarchical structure because new relationships could be established between data. But because the structure still needed to be defined in advance (Williams & Sawyer, 2013), it still was fairly inflexible.
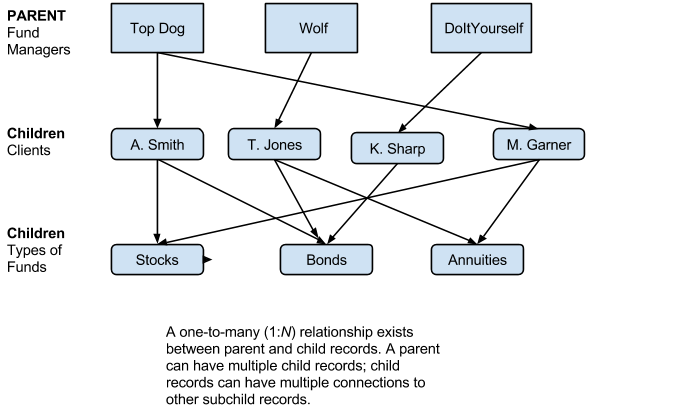
Figure \(\PageIndex{2}\): CC-BY by Janet Zimmer.
Relational Model
The relational database model grew out of this need for greater flexibility in adding new fields and tables, and to retrieve just the information desired for a particular purpose. Instead of each record containing all the information about a person, place, event, etc., the information is spread across different tables. But these tables must have some means of connecting the different types of data that are used to describe an individual, place, thing, or event. That is accomplished by inserting a common key field, called the primary key, into each record to link the records in separate tables. So if one table contains a fund manager’s name, another client information, another fund types, and another the value of investments, a unique field common to each table links the records from the different tables. If an identification (ID) number is the primary key, each record in the various tables that are associated with an individual, for example, will have the same ID number as one of its fields.
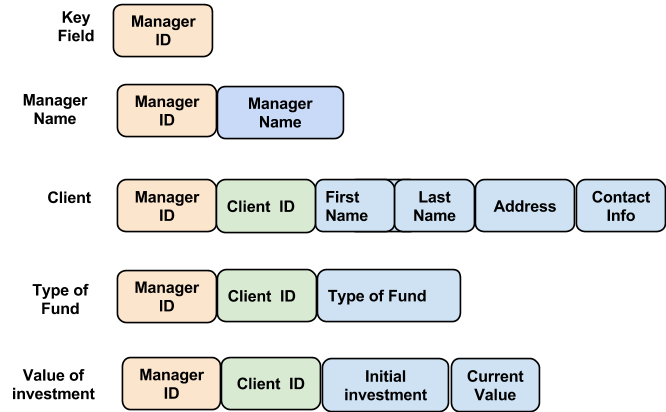
Figure \(\PageIndex{3}\): CC-BY by Janet Zimmer.
This is how the data in the tables might appear:
|
1 |
|
2 |
|
3 |
|
Manager ID |
Manager Name |
|---|---|
|
1 |
Top Dog |
|
2 |
Wolf |
|
3 |
DoItYourself |
|
Manager ID |
Client ID |
First Name |
Last Name |
Address |
Contact Info |
|---|---|---|---|---|---|
|
1 |
AAA |
A |
Smith |
1234 Hemlock Rd. Huntsville, AL |
345-555-4321 |
|
2 |
BBB |
M |
Garner |
3680 Pines Blvd. Ft. Lauderdale, FL |
954-555-9876 |
|
3 |
CCC |
K |
Sharpe |
34 E. Hilltop Ave. San Francisco, CA |
846-123-5555 |
|
Manager ID |
Client ID |
Fund type |
|---|---|---|
|
1 |
AAA |
Stocks |
|
1 |
AAA |
Bonds |
|
2 |
BBB |
Bonds |
|
2 |
BBB |
Annuities |
|
3 |
CCC |
Stocks |
|
Manager ID |
Client ID |
Initial Investment |
Current Value |
|---|---|---|---|
|
1 |
AAA |
$500 |
$50,000 |
|
2 |
BBB |
$99,000 |
$2,465,723 |
|
3 |
CCC |
$4,500 |
$495,000 |
In this case, new fields in the existing tables or even completely new tables can be added—perhaps an e-mail address for the client, or a new fund type. If the Manager ID is maintained as the primary key in each new table and the secondary key for the client in the appropriate tables, then links to the other information in the other tables can be maintained without rebuilding the database.
It is easy to retrieve specific information from the relational database, as there is no need to retrieve all the information spread across different tables with all fields, as was necessary in a hierarchical database. The fields from specified tables are accessed via a special database language called Structured Query Language (SQL). This same language is used to create, modify, and maintain a relational database. When you use wizards in MS Access to create databases, enter the data, and retrieve data for specified reports, you have used a wizard based on the SQL needed to manipulate the database.
Object-Oriented Model
There are two other database models we will touch on briefly here: the object-oriented database and the multidimensional database. In an object-oriented database, the data itself is conceived of as objects. The object can consist of data (character, numeric, etc.), or it can be instructions on what to do with that data. For example, in a relational database, all the elements that make up a dog—nose, eyes, mouth, ears, body, legs, tail—would be stored in separate fields. In an object-oriented database, all these components would be stored in one “object,” the dog.
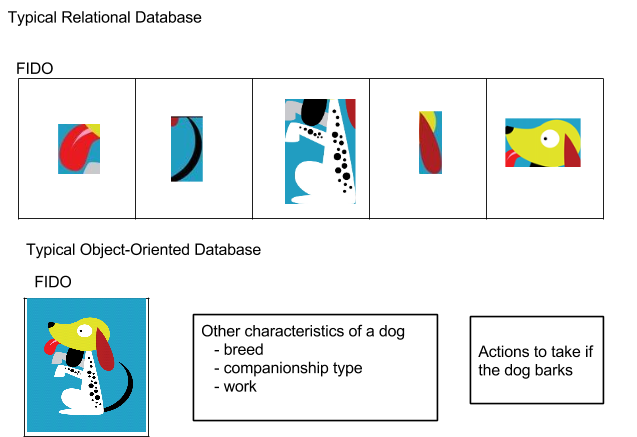
Figure \(\PageIndex{4}\): CC-BY by Janet Zimmer.
An object-oriented database is especially useful in areas such as design; scientific experiments; telecommunications; geographical information systems (GIS); and multimedia such as photos, sound files, and video (Williams & Sawyer, 2013). Note that all of these applications rely heavily on the use of images or multimedia. Those types of data cannot as easily be stored in the typical relational database where all the fields are typically character-, text-, or number-based. In object-oriented databases, the data in various tables are linked to and accessed by the use of pointers instead of common fields as in the relational database.
Multidimensional Model
The final database model is the multidimensional database, built and used optimally for data warehouse and online analytical processing applications. A special type of database language called online analytical processing (OLAP) or multidimensional OLAP (MOLAP) is used to manipulate the data in these types of databases.
Integrity and Validity of the Data
What is common to all database structures, whether hierarchical, relational, object-oriented, or multidimensional, is the support for ease of entry (adding records), retrieving the desired information, updating or correcting records, and ensuring that the data in the database is accurate. Data integrity should ensure that the data can be verified as correct, is up to date or timely, is organized in a way that is useful, is accessible to the user when it is needed, and is cost effective (that is, its value is greater than the cost to produce the data). Data validity is accomplished by comparing data that is being entered to a set of rules to ensure that the entry complies with those rules (Shelly & Vermaat, 2013). For example, if text data is entered into a field which has been set up to accept only numbers, the user entering the data should be alerted immediately to the mismatch.
All of the database models support the following advantages, to some extent, over a file processing system (one in which data is stored in flat files—that is, with no connections between the data in the files).
- Reduced data redundancy: Duplicate data is more easily avoided.
- Improved data integrity: Changes are made in one place instead of needing to search through multiple files or spreadsheets to find where changes need to be made.
- Shared data: A single set of data in the database can be shared with multiple users. Security settings define which users can access, add, modify, or delete records.
- Easier access: With appropriate software and access privileges, a nontechnical person can use the database without needing to know the complexity of the underlying structure.
- Reduced development time: The tools available for creating a database can result in an easier and faster development process than would be required for developing and maintaining multiple separate files that have been created and organized for different types of users or departments.
There are some challenges to the creation and use of databases, as well.
- A database system may be more complex than a series of spreadsheets or lists and may require people with special training to design and implement the database.
- A database consumes more memory, storage, and processing power than a file processing system.
- Because a great deal of information is stored in the database, if it is lost or the data become corrupt and unusable, it may affect all those who need to access the data.
- Unauthorized access to a database containing personally identifiable information (PII) could result in harm to those individuals whose information is accessed (Shelly & Vermaat, 2013).
did I get this
Which of the following database models uses a key or common data element to connect data in different files or tables?
Databases versus Spreadsheets
People may still use spreadsheet applications where a database would be a better choice for organizing data. For some, the familiarity of spreadsheet programs makes using them easier than the trouble involved in learning how to create and use a database. But there are several reasons why, when it is appropriate, it is better to use a database than a spreadsheet.
Data integrity and data validation are better supported by a database than in a spreadsheet. For example, in a spreadsheet, if a user applies a sort on one field but does not include any other columns, the data become totally disjointed. There are very few validity checks that can be inserted in spreadsheet fields.
A relational database stores data in one place and minimizes redundancy. Data can be updated in one place and only takes up the space it needs. Multiple entries of the same data in a spreadsheet may lead to confusion: If a different address is used for a customer in three separate rows with that customer’s name, which one is correct (Spreadsheets vs Database, 2013)?
Here are some rules of thumb that might help you decide whether a database or a spreadsheet is more appropriate:
Use a database if...
- the amount of information is so large that putting it into a spreadsheet would become unmanageable. For example, if all the data for every person holding a particular credit card—name, address, credit limit, purchases, billing statements, etc.—were stored in a spreadsheet, it would be difficult to view and keep current all the information about thousands of customers.
- the information is liable to change often. Such changes might include addresses, pricing, manager names, personnel, or contact names.
- you need reports that include specific information—for example, mailing labels, contact reports, company names, and addresses.
Use a spreadsheet if...
- your work primarily involves number crunching and calculations for which you can enter a formula.
- you need only a simple list of data.
- charts and graphs of your data are important and you want to create these easily.
- you want to manipulate the data to show "what if" results for different scenarios (Stille, n.d.).
did I get this
Which of the following would be best represented by data or a spreadsheet? Select Database or Spreadsheet for each option.
You need to present results in graphical formats.
You need to create mailing labels from the information.
You need to apply some complex numerical functions on the data.
You need to perform trend analyses or insert conditional formatting.
You have a large amount of information with complex relationships between the items.
Reset this Activity
learn by doing
Your company, Supply Solutions, has tasked you with developing a method for storing data related to customers: company name, address, contact person, product purchased, and amount of sale. You also need to print invoices, track shipment information, and send catalogs to customers you have worked with in the past. These customers resupply their inventory each month, so you need to create reports that calculate the monthly and yearly total revenue for your company. But you also need to be able to quickly calculate what an increase or decrease in product prices and/or sales would do to the overall revenue generation, along with a way to analyze trends.
Which component(s) below would create the best solution? Select Yes or No for each option.
Create a database that handles all the data related to customers, invoices, shipments, and calculates impacts on revenue resulting from an increase or decrease in prices and/or sales.
Create a spreadsheet with all the data related to customers, invoices, shipments, etc., and also calculates impacts on revenue resulting from an increase or decrease in prices and/or sales.
Create a database that handles all the data related to customers, invoices, shipments, etc.
Create a spreadsheet that calculates impacts on revenue resulting from an increase or decrease in prices and/or sales.
Reset this Activity
References
- Shelly, G. B., & Vermaat, M. E. (2013). Discovering Computers 2013. Boston: Course Technology.
- Spreadsheets vs Database. (2013). Retrieved September 7, 2013, from http://en.wikipedia.org/wiki/Scareware.
- Stille, K. (n.d.). Database vs. Spreadsheet. Retrieved January 27, 2014, from qcisolutions: http://www.qcisolutions.com/dbinfo1.htm.
- Williams, B. K., & Sawyer, S. C. (2013). Using Information Technology. New York: McGraw-Hill.

