8.2: Data versus Evidence
- Page ID
- 5672
\( \newcommand{\vecs}[1]{\overset { \scriptstyle \rightharpoonup} {\mathbf{#1}} } \)
\( \newcommand{\vecd}[1]{\overset{-\!-\!\rightharpoonup}{\vphantom{a}\smash {#1}}} \)
\( \newcommand{\id}{\mathrm{id}}\) \( \newcommand{\Span}{\mathrm{span}}\)
( \newcommand{\kernel}{\mathrm{null}\,}\) \( \newcommand{\range}{\mathrm{range}\,}\)
\( \newcommand{\RealPart}{\mathrm{Re}}\) \( \newcommand{\ImaginaryPart}{\mathrm{Im}}\)
\( \newcommand{\Argument}{\mathrm{Arg}}\) \( \newcommand{\norm}[1]{\| #1 \|}\)
\( \newcommand{\inner}[2]{\langle #1, #2 \rangle}\)
\( \newcommand{\Span}{\mathrm{span}}\)
\( \newcommand{\id}{\mathrm{id}}\)
\( \newcommand{\Span}{\mathrm{span}}\)
\( \newcommand{\kernel}{\mathrm{null}\,}\)
\( \newcommand{\range}{\mathrm{range}\,}\)
\( \newcommand{\RealPart}{\mathrm{Re}}\)
\( \newcommand{\ImaginaryPart}{\mathrm{Im}}\)
\( \newcommand{\Argument}{\mathrm{Arg}}\)
\( \newcommand{\norm}[1]{\| #1 \|}\)
\( \newcommand{\inner}[2]{\langle #1, #2 \rangle}\)
\( \newcommand{\Span}{\mathrm{span}}\) \( \newcommand{\AA}{\unicode[.8,0]{x212B}}\)
\( \newcommand{\vectorA}[1]{\vec{#1}} % arrow\)
\( \newcommand{\vectorAt}[1]{\vec{\text{#1}}} % arrow\)
\( \newcommand{\vectorB}[1]{\overset { \scriptstyle \rightharpoonup} {\mathbf{#1}} } \)
\( \newcommand{\vectorC}[1]{\textbf{#1}} \)
\( \newcommand{\vectorD}[1]{\overrightarrow{#1}} \)
\( \newcommand{\vectorDt}[1]{\overrightarrow{\text{#1}}} \)
\( \newcommand{\vectE}[1]{\overset{-\!-\!\rightharpoonup}{\vphantom{a}\smash{\mathbf {#1}}}} \)
\( \newcommand{\vecs}[1]{\overset { \scriptstyle \rightharpoonup} {\mathbf{#1}} } \)
\( \newcommand{\vecd}[1]{\overset{-\!-\!\rightharpoonup}{\vphantom{a}\smash {#1}}} \)
\(\newcommand{\avec}{\mathbf a}\) \(\newcommand{\bvec}{\mathbf b}\) \(\newcommand{\cvec}{\mathbf c}\) \(\newcommand{\dvec}{\mathbf d}\) \(\newcommand{\dtil}{\widetilde{\mathbf d}}\) \(\newcommand{\evec}{\mathbf e}\) \(\newcommand{\fvec}{\mathbf f}\) \(\newcommand{\nvec}{\mathbf n}\) \(\newcommand{\pvec}{\mathbf p}\) \(\newcommand{\qvec}{\mathbf q}\) \(\newcommand{\svec}{\mathbf s}\) \(\newcommand{\tvec}{\mathbf t}\) \(\newcommand{\uvec}{\mathbf u}\) \(\newcommand{\vvec}{\mathbf v}\) \(\newcommand{\wvec}{\mathbf w}\) \(\newcommand{\xvec}{\mathbf x}\) \(\newcommand{\yvec}{\mathbf y}\) \(\newcommand{\zvec}{\mathbf z}\) \(\newcommand{\rvec}{\mathbf r}\) \(\newcommand{\mvec}{\mathbf m}\) \(\newcommand{\zerovec}{\mathbf 0}\) \(\newcommand{\onevec}{\mathbf 1}\) \(\newcommand{\real}{\mathbb R}\) \(\newcommand{\twovec}[2]{\left[\begin{array}{r}#1 \\ #2 \end{array}\right]}\) \(\newcommand{\ctwovec}[2]{\left[\begin{array}{c}#1 \\ #2 \end{array}\right]}\) \(\newcommand{\threevec}[3]{\left[\begin{array}{r}#1 \\ #2 \\ #3 \end{array}\right]}\) \(\newcommand{\cthreevec}[3]{\left[\begin{array}{c}#1 \\ #2 \\ #3 \end{array}\right]}\) \(\newcommand{\fourvec}[4]{\left[\begin{array}{r}#1 \\ #2 \\ #3 \\ #4 \end{array}\right]}\) \(\newcommand{\cfourvec}[4]{\left[\begin{array}{c}#1 \\ #2 \\ #3 \\ #4 \end{array}\right]}\) \(\newcommand{\fivevec}[5]{\left[\begin{array}{r}#1 \\ #2 \\ #3 \\ #4 \\ #5 \\ \end{array}\right]}\) \(\newcommand{\cfivevec}[5]{\left[\begin{array}{c}#1 \\ #2 \\ #3 \\ #4 \\ #5 \\ \end{array}\right]}\) \(\newcommand{\mattwo}[4]{\left[\begin{array}{rr}#1 \amp #2 \\ #3 \amp #4 \\ \end{array}\right]}\) \(\newcommand{\laspan}[1]{\text{Span}\{#1\}}\) \(\newcommand{\bcal}{\cal B}\) \(\newcommand{\ccal}{\cal C}\) \(\newcommand{\scal}{\cal S}\) \(\newcommand{\wcal}{\cal W}\) \(\newcommand{\ecal}{\cal E}\) \(\newcommand{\coords}[2]{\left\{#1\right\}_{#2}}\) \(\newcommand{\gray}[1]{\color{gray}{#1}}\) \(\newcommand{\lgray}[1]{\color{lightgray}{#1}}\) \(\newcommand{\rank}{\operatorname{rank}}\) \(\newcommand{\row}{\text{Row}}\) \(\newcommand{\col}{\text{Col}}\) \(\renewcommand{\row}{\text{Row}}\) \(\newcommand{\nul}{\text{Nul}}\) \(\newcommand{\var}{\text{Var}}\) \(\newcommand{\corr}{\text{corr}}\) \(\newcommand{\len}[1]{\left|#1\right|}\) \(\newcommand{\bbar}{\overline{\bvec}}\) \(\newcommand{\bhat}{\widehat{\bvec}}\) \(\newcommand{\bperp}{\bvec^\perp}\) \(\newcommand{\xhat}{\widehat{\xvec}}\) \(\newcommand{\vhat}{\widehat{\vvec}}\) \(\newcommand{\uhat}{\widehat{\uvec}}\) \(\newcommand{\what}{\widehat{\wvec}}\) \(\newcommand{\Sighat}{\widehat{\Sigma}}\) \(\newcommand{\lt}{<}\) \(\newcommand{\gt}{>}\) \(\newcommand{\amp}{&}\) \(\definecolor{fillinmathshade}{gray}{0.9}\)“Data” has been widely, but imprecisely, used in education for most of the 21st century. Data-driven educators make decisions based on information they have gathered about their students’ performance. Ostensibly, this is done in an attempt to adopt the position of a researcher and to ground decisions in objective research, thus give more support for their decisions. Upon closer inspection, however, there is little resemblance between data collection, the data, and the analysis methods used by researchers and those used by most “data-driven educators.”
Data-driven educators tend to use data that is conveniently available; this data is almost always scores on a standardized or standards-based tests. These tests include both large scale and high stakes tests and also those administered by teachers in the classroom for diagnostic purposes. The validity and reliability of these tests is rarely questioned; educators who claim to be data-driven accept that the tests accurately measure what the publishers claim. Data-driven educators also tend to seek interesting and telling trends in the data, but rarely do they seek to answer specific questions using their data. Further, they rarely use theory to interpret results; it is assumed that instruction determined the scores and that changes to instruction affected all trends they observe.
Researchers, on the other hand, define the questions they seek to answer and the data methods they will use prior to gathering data; they gather only the data they need, and all data is interpreted in light of theory. Researchers challenge themselves and their peers to justify all assumptions and to demonstrate the validity and reliability of instruments that generate data and they challenge themselves and peers to demonstrate the quality of their data and conclusions; for researchers, conclusions based on invalid or badly (or unethically) collected data must be discarded by credible researchers and managers.
By adopting a stance towards data that more closely resembles research than data-driven decision-making, IT managers tend to base their decisions in data that is more valid and reliable than is commonly used in education. Their decisions are also more likely to be grounded in theory that helps explain the observations. Other benefits of adopting a research-like stance towards data and evidence include:
- More efficient processes as planners use theory to focus efforts on relevant factors and only relevant factors;
- More effective decisions, because multiple reliable and valid data are used;
- More effective interventions, because they focus on locally important factors and there is a clear rationale for actions;
- Assessments and evaluations of interventions are more accurate and more informative for further efforts because evidence is clear and clearly understood.
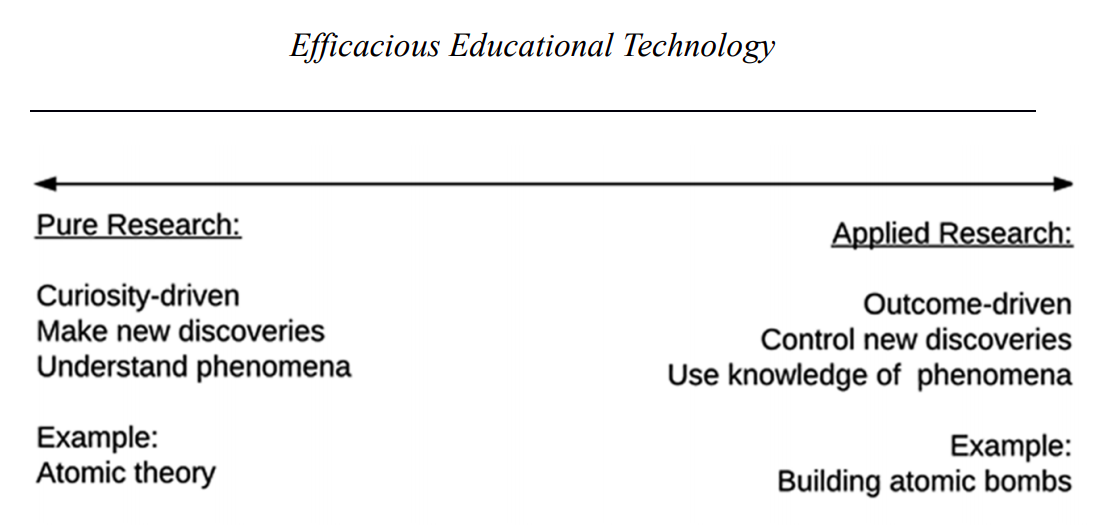
Research is generally differentiated into two types. Pure research is designed to generate and test theory, which contains ideas about how phenomena work and allows researchers to predict and explain what they observe. Applied research is undertaken to develop useful technologies that leverage the discoveries of pure research; applied research is often called technology development. Scholars who engage in pure research identify and provide evidence for cause and effect relationships; this is typically done through tightly controlled experiments and quantitative data. Scholars and practitioners who engage in applied research or technology development seek to produce efficient and effective tools (see Figure 7.2.1).

Figure \(\PageIndex{1}\): Continuum of pure and applied research
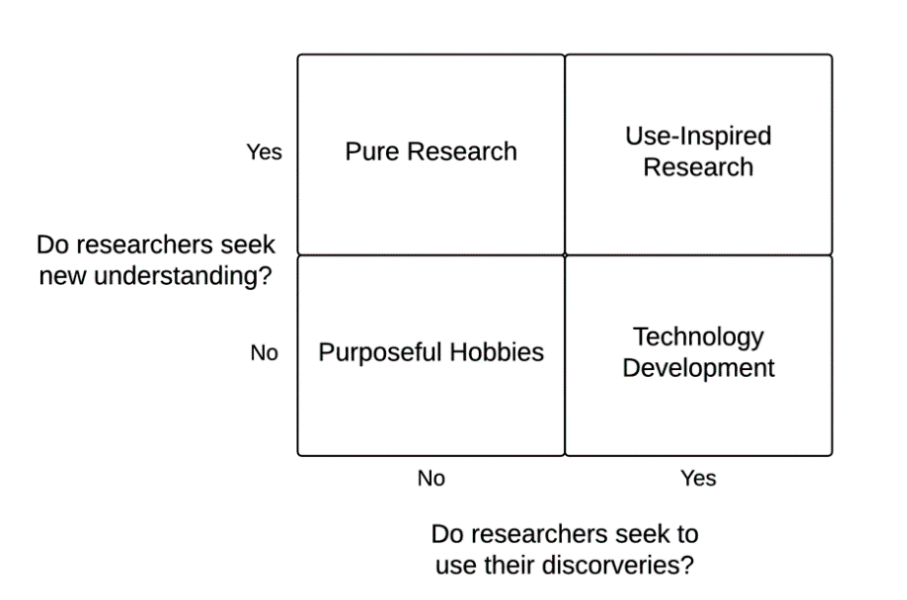
In 1997, Donald Stokes suggested designing a project to be one type of research does not prevent one from doing the other type, so the dichotomy of pure and applied research is misleading. According to Stokes, many researchers seek to create new knowledge and to solve human problems simultaneously; he suggested replacing the continuum of pure to applied research with a matrix in which one axis is labeled “Do researchers seek new understanding?” and the other is labeled “Do researchers seek to use their discoveries?” By dividing each axis into “yes” and “no” sections, four types of research emerge (see Figure 7.2.2).

Figure \(\PageIndex{2}\): Matrix of research activities
Pure and applied research as they were originally conceived do remain on this new matrix. The cognitive scientists who study brain structure and function with little concern for converting their discoveries into interventions are pure researchers whose work may ultimately affect education, but designing interventions is not their primary purpose. The activity of computer programmers who are developing and refining educational games falls into the technology development quadrant. In general, they seek to build systems that are efficient, and they build their systems to leverage the discoveries of cognitive scientists, but their work does not contribute to new understanding.
Stokes’ matrix introduces a category of research in which there is neither intent to make new discoveries nor intent to apply any discoveries. While it may seem a null set, there are interesting and fulfilling hobbies such as bird watching that fall into this quadrant. Similar activities are those in which discoveries and applications of knowledge is for personal fulfillment and entertainment. Stokes’ matrix also introduces a category of activity in which the researcher intends to both make new discoveries and apply the discoveries; he labeled this “use-inspired research” and referred to it as Pasteur’s quadrant. You may recall Louis Pasteur was a 19th century French biologist and he “wanted to understand and to control the microbiological processes he discovered” (Stokes, 1997 p. 79). Pasteur’s approach was to both explain the natural science of these diseases and to define interventions that would prevent them. In the same way, IT managers seek to build efficacious systems in their schools and to understand what makes them so.
At the center of use-inspired research is an intervention which is designed to solve a problem. In school IT management, interventions will include many and diverse systems of hardware, software, and procedures and methods to use that hardware and software. Because it is focus of research, interventions can be understood in terms of theory. Theory explains what is observed, and theory predicts what will be observed when systems are changed. Because it is the focus of technology development, interventions are revised so that desired changes are observed. Useinspired researchers also seek to observe performance in multiple ways. A single measure is not sufficient for the efficacious IT manager whose planning and decision-making is grounded in useinspired research.
Education and research form a complex situation. Education is a field of active and diverse research; pure research, technology development, action research, and evaluation research all contribute to emerging collection of research. Further, a course in education research is part of almost every graduate program in the field, so many education professionals believe they have a sophisticated capacity to use and even generate research. Despite this, Carr-Chellman and Savoy (2004) observed that inattention to evidence and data in education led to “many innovations being less than acceptable or usable and rarely effectively implemented,” but they concluded, “frustration with the lack of relevant useful results have led to more collaborative efforts to design, develop, implement, and benefit from research, processes, and products” (p. 701). Given this observation, it is reasonable to conclude that useinspired research will improve the collaborative efforts so school IT systems are properly, appropriately, and reasonably designed.


